Support
Apple beats earnings expectations, but shares slip in after-hours trading
Apple surpassed quarterly expectations, posting $114.48 billion in revenue and an earnings per share (EPS) of $2.10. However, shares fell by approximately 3% in after-hours trading following projected gross margin declines driven by escalating memory chip costs.
Apple's quarterly revenue reached $114.48 billion, whilst EPS attained $2.10, both exceeding market expectations.
Year-over-year growth registered at 11.72% for revenue and 13.51% for EPS, underscoring solid financial performance.
Projected gross margins for the upcoming quarter declined to between 45% and 46%, suppressed by rising memory chip costs.
Robust operating margins (31.12%) and strong cash flows continue to support capital returns for shareholders.
Date: 3 November 2026 (GMT+3)
Why are Apple shares falling despite beating earnings expectations?
Apple Inc. released a solid quarterly earnings report, exceeding analysts' expectations on both total revenue and earnings per share (EPS). The technology giant reported revenue of $114.48 billion, surpassing consensus estimates of $113.38 billion. In turn, the company delivered an EPS of $2.10, well above the $1.99 anticipated by the market consensus. These results represent a year-over-year (YoY) revenue growth rate of 11.72% alongside an annual EPS expansion of 13.51%.
However, following the earnings announcement, Apple's shares fell by approximately 3% in post-market trading. The underlying decline in share price is primarily attributable to a softer gross margin projection for the upcoming quarter (between 45% and 46%), as the company warned of persistent cost inflation in memory chips—as reported by Reuters. This forward-looking guidance sits below the 47.9% gross margin achieved in the current quarterly report.
Notably, the company seeks to maintain robust operational performance in upcoming quarters, bolstered by flagship product lines such as the iPhone Duo, iPhone 18, and iPhone 18 Pro Max.
Additionally, the firm achieved an operating margin of 31.12% and a net margin of 26.8%, both hovering close to historical averages. Furthermore, operating cash flow remains exceptionally strong, enabling the company to reward shareholders through capital allocation via dividends and common stock repurchases.
Against this backdrop, although Apple's shares experienced a post-market decline, the long-term technical trend remains firmly bullish, underpinned by the company's solid fundamentals.
Technical analysis of Apple’s shares
From a technical perspective, Apple’s share price maintains a long-term bullish channel pattern. Primary structural observations include:
- Trend Context: On longer-term timeframes, Apple preserves a market structure defined by a consistent sequence of higher highs and higher lows. The price continues to trade comfortably above its 100-day and 200-day Simple Moving Averages (SMAs), confirming underlying trend strength. However, over the past quarter, the price has struggled to overcome resistance around the $343 zone—a technical ceiling where the Volume Profile's Value Area High (VAH) resides.
- Momentum Indicators: Both the Moving Average Convergence Divergence (MACD) and the Relative Strength Index (RSI) are currently trending downwards, suggesting that short-term bearish momentum could intensify. Notably, the MACD is signalling a bearish divergence, increasing the likelihood of a potential price retracement or consolidation phase.
- Resistance Levels: Should bullish momentum regain strength, the immediate critical resistance sits at $349—the record high. If this technical threshold is breached to the upside, the next major resistance is $360, a prominent psychological barrier that converges with the upper boundary of the bullish channel.
- Support Levels: If immediate support at $326 fails to hold, the primary structural floor is identified at $310—a key level that converges with the Volume Profile's Point of Control (POC). A failure to defend the $310 zone would increase the probability of a deeper market correction towards the $300 psychological threshold, where the 200-day SMA currently sits.
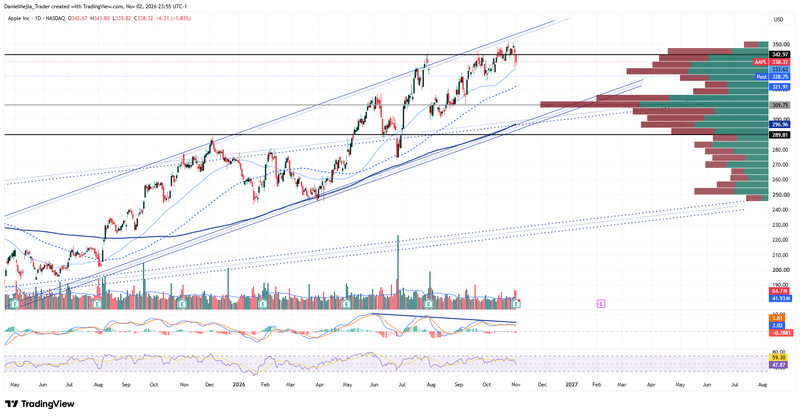
Figure 1. Apple’s Share Price (2025–2026). Source: Data from the Nasdaq Exchange; author's analysis conducted via TradingView.