
 Support
 Intel beats Q2 2026 estimates; Stock gains post-market
Intel Corporation surpassed Wall Street estimates for the second quarter of 2026, posting $16.13 billion in revenue and a non-GAAP earnings per share (EPS) of $0.42. Strong growth across artificial intelligence (AI) and data center segments propelled the company's shares up by over 3% in post-market trading.
Intel’s Q2 revenue rose 25.4% year-on-year (YoY) to $16.13 billion, while non-GAAP EPS doubled consensus forecasts to reach $0.42.
Growth was largely driven by client computing growth, while the Data Center and AI segment expanded by 59% YoY.
The debt ratio has dropped to 24% alongside steady asset growth, mitigating historical leverage risks.
Date: 23 July 2026
Intel posts better-than-expected Q2 2026 earnings; Shares advance post-market
Intel Corporation beat analysts’ forecasts for total revenue and earnings per share (EPS) in its Q2 financial results. The semiconductor giant reported total revenue of $16.13 billion, comfortably exceeding the market estimate of $14.33 billion. Concurrently, the company achieved a non-GAAP EPS of $0.42, doubling the market consensus of $0.21. These results reflect a year-on-year (YoY) revenue increase of 25.4% and a solid YoY recovery in profitability, compared with a loss of -$0.10 per share reported in Q2 2025. Consequently, Intel’s shares rose by 3.16% in post-market trading, changing hands near $103.30.
Notably, top-line expansion represented the company's fastest growth rate in nearly 15 years, as reported by CNBC. Against this backdrop, Intel also surpassed market expectations for its Q3 2026 outlook, bolstered by strong AI product adoption. Among the primary business segments, the Data Center business expanded by 59% YoY, while the Client Computing Group advanced by 13% YoY.
Financial overview of Intel
Although Intel experienced a multi-year downward trend in total revenue, the company has reversed this trajectory as its AI and data center offerings demonstrate robust operational performance. This turnaround is evidenced by the last two quarters, where YoY revenue growth registered at +7.2% in Q1 and +25.4% in Q2, shifting away from its negative historical average of -2.8%. Meanwhile, asset management metrics reveal steady balance-sheet expansion, and the debt ratio has fallen to 24%, significantly reducing the firm's financial leverage risks.
In summary, Intel is strengthening its top-line performance on the back of rising demand for AI and data center hardware, while expanding its asset base and maintaining lower leverage. Nevertheless, overall bottom-line net income remains constrained following several quarters of cumulative net losses. Notably, the reported diluted EPS of $0.42 reflects a Non-GAAP metric, adjusting for one-off charges to capture the core operational performance of the enterprise.
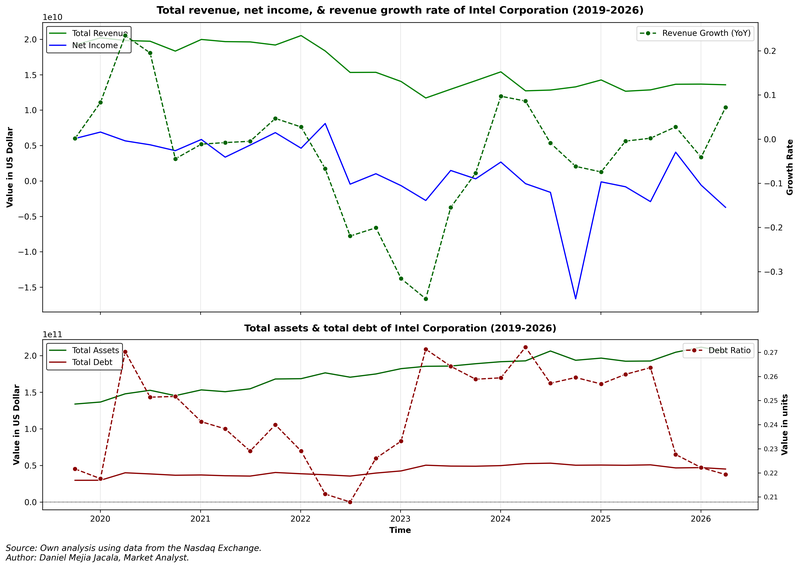
Figure 1. Intel’s Revenue, Net Income, Total Debt, & Total Assets (2019–2026). Source: Own analysis using data from the Nasdaq Exchange.
Technical analysis of Intel’s share price
From a technical perspective, Intel’s share price maintains a robust primary bullish trajectory. Key structural observations include:
- Trend Context: On the long-term horizon, Intel Corporation retains a market structure defined by a series of "higher highs" and "higher lows". The equity is currently trading comfortably above its 100-period and 200-period Simple Moving Averages (SMAs).
- Resistance Levels: Provided the short-term support near the $100 psychological threshold holds and prices reject lower levels to the upside, the primary technical ceilings are identified at $116 and $130, respectively—zones where consolidation occurred in recent months. A decisive breakout above these levels would signal potential for further upward extension.
- Support Levels: In the event of a retracement, the $100 region provides immediate structural support. Below this level, the next major floor is situated at $75, serving as a long-term structural pivot point. A failure to hold $75 would increase the probability of a deeper corrective move.
- Momentum Indicators & Volume: Both the Moving Average Convergence Divergence (MACD) and the Relative Strength Index (RSI) are exhibiting short-term downward trajectories. However, fundamental earnings drivers are expected to dictate the broader directional bias over the coming periods.
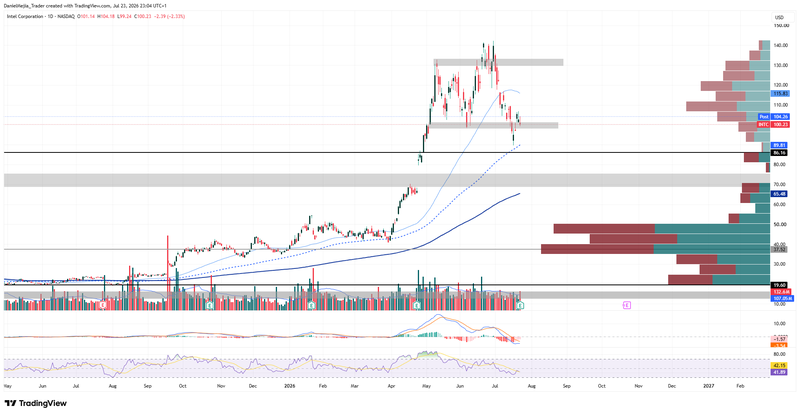
Figure 2. Intel Share (2025–2026). Source: Data from the Nasdaq Exchange; Own analysis conducted via TradingView.


