Support
Meta delivers mixed Q3 results: key financial and technical insights
Meta delivered mixed Q3 2026 financial results, characterised by robust revenue growth alongside reduced earnings resulting from litigation costs. Amid significant selling pressure, market participants remain concerned over substantial capital expenditure on artificial intelligence (AI) infrastructure and its long-term sustainability.

Meta's revenue rose 26% year-on-year to $64.60 billion, demonstrating solid top-line expansion.
Diluted EPS fell to $3.83 due to a $9.89 billion legal settlement charge.
Total debt expanded, pushing the debt-to-assets ratio to 23.4% and the debt-to-capital ratio to 42.16%.
Heavy spending on AI infrastructure has heightened investor concerns regarding investment sustainability.
Date: 28 October 2026 (GMT+3)
Why are Meta's shares declining following its Q3 earnings results?
Meta Platforms' shares have depreciated by approximately 11% in recent days following the publication of its Q3 2026 earnings report, in which the firm delivered mixed figures. Year-to-date (YTD), the stock has declined by roughly 6%.
On 21 October 2026, the social media giant reported revenue of $64.60 billion, surpassing market expectations of $63.34 billion. This represents a year-on-year (YoY) growth rate of 26%, signalling robust top-line momentum. Nevertheless, the company missed consensus estimates for earnings per share (EPS) of $6.54, reporting a figure of $3.83. Although this represents a YoY increase of 264%, it highlights a pronounced divergence between rising revenue and contracting net income (see Figure 1).
Notably, the company recognised a $9.89 billion expense charge in Q3 associated with the settlement of litigation regarding teen mental health and social media usage. Excluding this non-recurring item, diluted EPS would have reached approximately $7.40.
Financial analysis of Meta Platforms
From a fundamental perspective, Meta has demonstrated robust revenue performance, characterised by an upward trajectory. Over the 2020–2026 period, the average YoY revenue growth rate stood at 21%, despite a slight deceleration over the last two quarters. Conversely, the net margin has exhibited a significant divergence, contracting over two consecutive quarters to approximately 15%—well below the historical average of 30% observed across the analysed period.
Regarding capital deployment and balance sheet expansion, Meta’s total assets have continued to grow consistently, reflecting the company's commitment to long-term growth. However, total debt has increased concurrently, elevating the debt-to-assets ratio to 23.4% in Q3 2026. Consequently, a growing reliance on external financing may be dampening investor sentiment as leverage increases. According to data from Investing.com, Meta's debt-to-capital ratio currently stands at 42.16%, slightly exceeding the industry average of 37.39%.
In this context, market participants appear concerned that heavy capital expenditure (CapEx) associated with artificial intelligence (AI) initiatives is not being fully funded by operational cash flows. Instead, the firm has turned to debt financing to sustain its growth projects. Furthermore, tangible financial returns from AI investments have yet to fully translate into operational profitability, which continues to weigh on investor confidence.
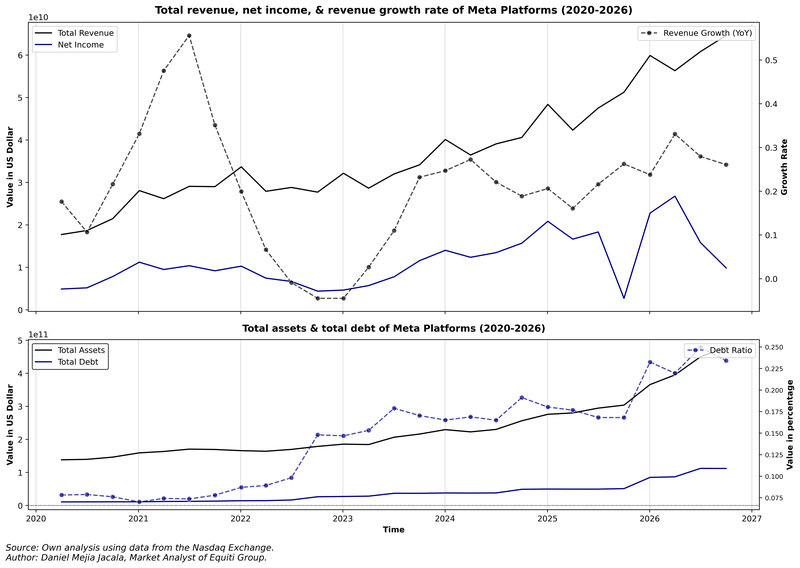
Figure 1. Meta’s Revenue, Net Income, and Revenue Growth Rate (2020–2026). Source: Author's analysis using data from the Nasdaq Exchange.
Technical analysis of Meta’s share price
Regarding the technical outlook, Meta’s share price has maintained a highly volatile regime over the past year. Key technical observations include:
- Trend Context: Over the long term, Meta Platforms retains a market structure defined by "higher highs" and "higher lows". However, the stock is currently trading within a highly volatile consolidation range, positioned below its 50-day, 100-day, and 200-day simple moving averages (SMAs). This underscores a lack of clear directional momentum, with short-term bearish sentiment prevailing.
- Momentum Indicators: Both the Moving Average Convergence Divergence (MACD) and the Relative Strength Index (RSI) exhibit downward trajectories, indicating that short-term selling pressure may persist. However, the RSI is approaching oversold territory, suggesting caution regarding the sustainability of the bearish momentum.
- Resistance Levels: Should buying interest re-emerge, the immediate technical resistance ceiling lies at $685, followed by $777—a level approaching the record high of $790.
- Support Levels: Should selling pressure persist, the primary technical floor is identified at $597, where the Volume Profile Point of Control (POC) converges with a long-term ascending trendline. Secondary structural support is located at $509.
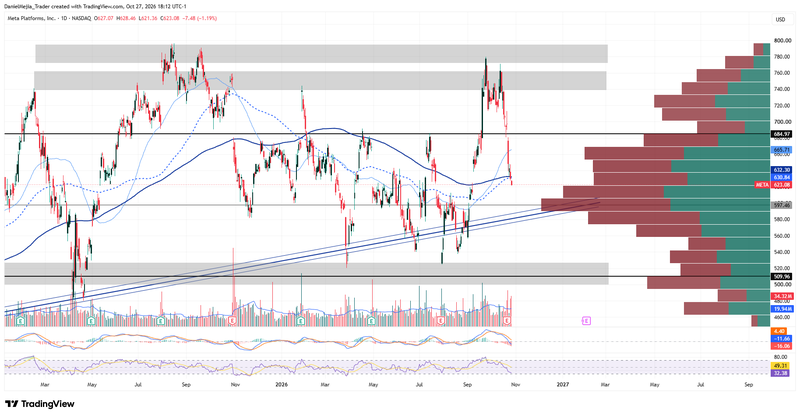
Figure 2. Meta’s Shares (2025–2026). Source: Data from the Nasdaq Exchange; Author's analysis conducted via TradingView.