
 Support
 Micron outlook ahead of earnings: a fundamental and technical overview
Ahead of its quarterly earnings release, Micron Technology exhibits strong revenue growth and healthy fundamentals, alongside a robust long-term bullish technical structure, although high market expectations leave little room for error.

Consensus forecasts predict $50.45 billion in revenue and an EPS of $31.16, representing substantial year-on-year growth.
Accelerating revenue, high net margins, and a low 4.7% debt-to-assets ratio signal robust financial statements health.
Despite a market capitalisation of $1.20 trillion, valuation multiples—such as the price-to-earnings (P/E) ratio of 24.18x—remain below industry averages.
Date: 30 September 2026
What are analysts expecting for Micron's quarterly earnings report?
Micron Technology (MU) is scheduled to release its quarterly earnings results. Market consensus expects the company to report total revenue of $50.45 billion alongside earnings per share (EPS) of $31.16. These figures would represent a year-on-year (YoY) revenue growth rate of 346% and an annual increase of 928% in EPS. While such implicit growth reflects solid operational performance, it also poses a risk for Micron's share price should the company fall short of forecasts or if its forward guidance fails to satisfy investors.
Recently, market participants have subjected quarterly earnings results to heightened scrutiny, particularly for artificial intelligence (AI)-related companies. Nevertheless, regardless of the immediate market reaction to Micron's earnings report, the firm's underlying fundamentals have demonstrated solid performance across recent quarters.
Financial overview of Micron Technology
Micron's financials have demonstrated strong performance over recent quarters. Both total revenue and net income reveal robust upward trajectories. While year-on-year (YoY) revenue growth has averaged 37% since 2020, the last three quarters have demonstrated accelerating growth of 56%, 196%, and 345%, subsequently. In turn, net income growth has averaged 116%. Additionally, the net margin has averaged 12.7%, reaching 68% in the most recent quarter. In summary, consolidated sales performance and overall profitability demonstrate significant strength, particularly since 2025 as growth accelerated.
Meanwhile, Micron's balance sheet reflects substantial asset growth, with total assets reaching $134.11 billion in the most recent quarter. This expansion in total assets has coincided with a steady decline in total debt. Consequently, the debt-to-assets ratio has decreased to 4.7%, indicating that asset growth has been financed primarily through operational cash flows rather than external borrowing. This underscores a prudent approach to financial risk management, as debt leverage does not pose a threat to operational liquidity.
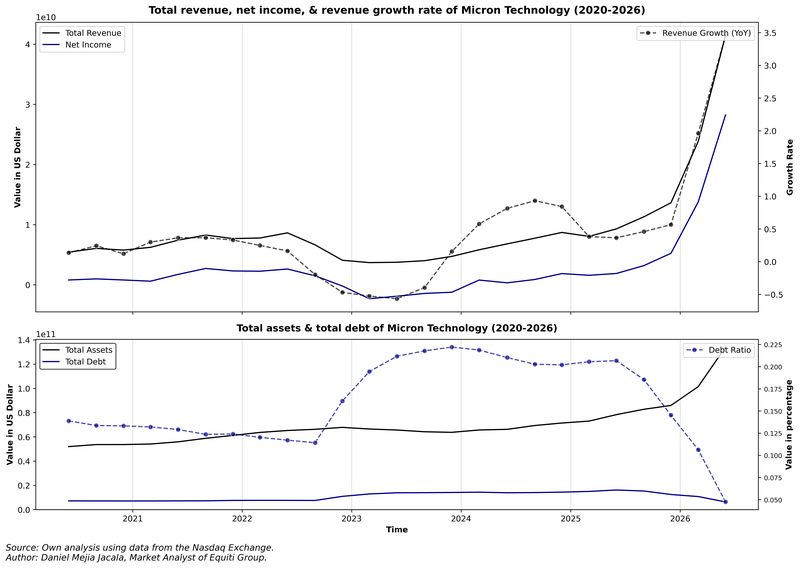
Figure 1. Micron’s Revenue, Net Income, Total Debt, & Total Assets (2020–2026). Source: Author's analysis based on data from the Nasdaq Exchange.
Additionally, even though Micron's market capitalisation has reached $1.20 trillion, valuation multiples do not appear overextended. According to Investing.com, Micron's price-to-earnings (P/E) ratio stands at 24.18x, the price-to-book (P/B) ratio is 12.13x, and the price-to-sales (P/S) ratio nears 13.54x. In all three cases, current valuation multiples remain below industry averages.
Technical analysis of Micron’s share price
Regarding the technical outlook, Micron’s share price maintains its primary bullish trend. Key observations include:
- Trend Context: Over the long term, Micron Technology retains a market structure characterised by higher highs and higher lows. The share price is currently trading well above its 50-day, 100-day, and 200-day moving averages, reinforcing the prevailing upward momentum. However, in the short term, the upward trajectory has not been accompanied by an expansion in trading volume, leaving the price vulnerable should selling pressure emerge.
- Resistance Levels: Should bullish momentum continue, the next significant resistance level is $1,212—the all-time high. A decisive breakout above this level would increase the likelihood of an extension into uncharted territory, with the $1,300 mark acting as the next major psychological barrier.
- Support Levels: In the event of a market retracement, the primary downside floor is the $1,000 threshold, which serves as a major psychological support level. Should this level fail to hold, the $900 region represents the next key support area. Breaching these support zones would heightening the probability of a deeper market correction.
- Momentum Indicators: Both the Moving Average Convergence Divergence (MACD) and the Relative Strength Index (RSI) are trending upwards, indicating that short-term bullish momentum could continue. Nevertheless, fundamental catalysts are expected to remain the primary driver of medium-term price action.
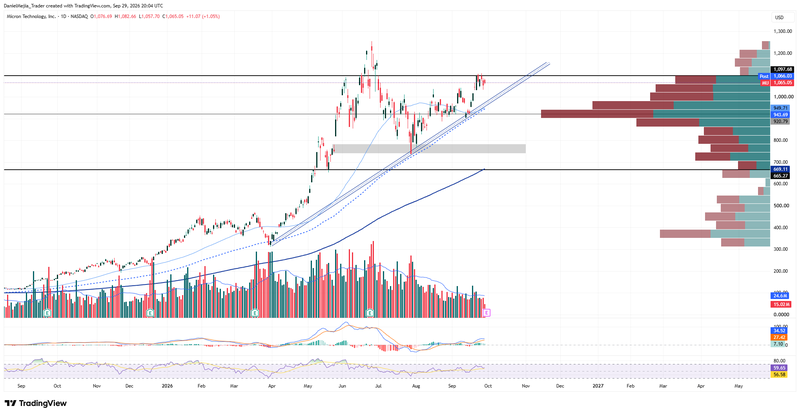
Figure 2. Micron’s Share Price (2025–2026). Source: Data from the Nasdaq Exchange; author's analysis conducted via TradingView.


