
 Support
 Morgan Stanley Q3 2026 earnings report: a fundamental and technical overview
Morgan Stanley’s third-quarter earnings exceeded market forecasts for revenue and earnings per share; however, its share price declined, weighed down by inflation-driven interest rate hike expectations.

Morgan Stanley’s Q3 net revenue reached $20.34 billion and earnings per share (EPS) reached $3.03, surpassing analysts' estimates.
The US Bureau of Labour Statistics released consumer and producer inflation data, reinforcing market expectations that the Federal Reserve could implement further interest rate hikes.
Shares fell by 2.56% to $182.10 amidst negative market sentiment tied to higher interest rate expectations.
Date: 16 October 2026
Why are Morgan Stanley shares falling following its Q3 earnings report?
Morgan Stanley (MS) exceeded analysts' estimates for both net revenue and earnings per share (EPS) in its third-quarter earnings report; however, its shares have accumulated a decline of 2.56% since the financial giant published its results. Currently trading at $182.10, Morgan Stanley reflects a market capitalisation of $286 billion.
The company reported net revenue of $20.34 billion, topping the market consensus estimate of $19.96 billion. Correspondingly, the firm posted quarterly earnings per share of $3.03, beating analysts' forecasts of $2.94. These figures represent a year-on-year (YoY) revenue growth rate of 11.6% and an 8.2% YoY increase in EPS. Furthermore, the company highlighted solid performance in both Wealth Management and Investment Management, underpinned by robust operational efficiency and rising demand.
Against this backdrop, the downward pressure on Morgan Stanley's share price appears to be linked to broader negative market sentiment, driven by heightened expectations that the Federal Reserve will adopt a more restrictive monetary policy stance. During the week, the Bureau of Labour Statistics (BLS) published updated readings for consumer and producer inflation. Both metrics revealed notable surges in price pressures, driven primarily by rising fuel costs, particularly in gasoline and diesel.
Consequently, the market-implied probability of an additional interest rate hike at the Federal Reserve's December meeting increased, according to the CME FedWatch Tool. A higher interest rate environment typically reduces demand for financial services as borrowing costs escalate for households and businesses. Conversely, elevated rates can benefit net interest revenues, while institutional and retail investment may increase as government and corporate bonds become more attractive to investors.
Meanwhile, regarding the price action of Morgan Stanley's shares, the technical breakdown below a significant ascending trendline suggests that market valuations could face further downward pressure.
Technical analysis of Morgan Stanley’s share price
Regarding the technical outlook, Morgan Stanley’s share price maintains its primary bullish macro trend; nevertheless, the price action has broken a key ascending trendline. Primary observations include:
- Trend Context: Over the long term, Morgan Stanley retains a market structure characterised by higher highs and higher lows. However, in the short term, the price is experiencing selling pressure that has pushed it below its 50-day, 100-day, and 200-day Simple Moving Averages (SMAs), reinforcing a near-term bearish bias. Notably, the stock has broken below both an upward trendline and a key structural support level, signalling the potential for further contraction.
- Momentum Indicators: The Moving Average Convergence Divergence (MACD) is signalling a bullish crossover from historically low levels, pointing to a potential short-term upward impulse. Furthermore, the Relative Strength Index (RSI) is trading in oversold territory, supporting the hypothesis of a short-term bullish reversal. Crucially, as these momentum signals diverge from the underlying price action, the evolution of market sentiment will be decisive for the stock's near-term trajectory.
- Bullish Scenario: Should bullish momentum re-emerge, the primary resistance level to consider is $193—where a structural ceiling converges with the long-term ascending trendline and the 200-day SMA. A decisive breakout above this level would increase the probability towards the next resistance level at $217, suggesting a resumption of the broader long-term uptrend.
- Bearish Scenario: If short-term selling pressure persists, the immediate downside support lies at $160, where key structural support aligns with the Volume Profile’s Point of Control (POC). A failure to hold this support zone would increase the likelihood of a deeper market correction.
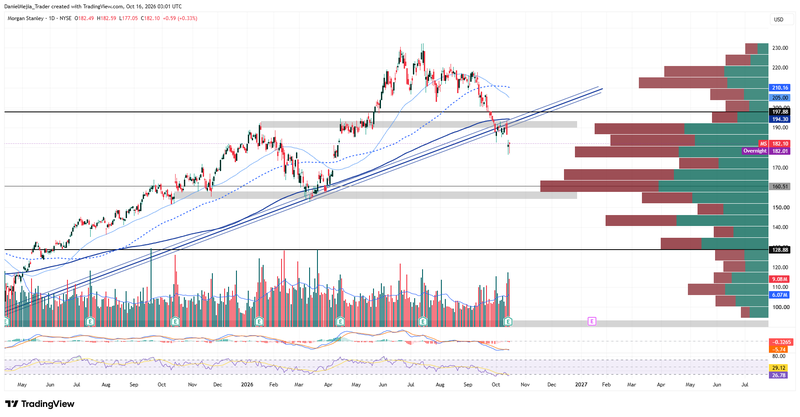
Figure 1. Morgan Stanley’s Share Price (2025–2026). Source: Data from the NYSE; author's analysis conducted via TradingView.


