
 Support
Netflix falls despite solid financial results amid slowing growth
Although Netflix reported strong third-quarter 2026 earnings that exceeded estimates, its share price dropped by 5.31% amid decelerating long-term growth and intense industry competition.
Netflix's revenue reached $12.87 billion (up 11.8% year-on-year), while diluted earnings per share (EPS) surged 47% YoY to $0.87.
Operating income stood at $4.46 billion, delivering a robust 34.6% operating margin.
The debt-to-assets ratio declined to 25% amidst healthy operating cash flow generation.
Date: 22 October 2026 (GMT+3)
Why are Netflix shares falling despite strong financial results?
Netflix Inc. released solid earnings results for the third quarter of 2026, exceeding consensus expectations for both total revenue and earnings per share (EPS). The streaming giant reported revenue of $12.874 billion, slightly outperforming market expectations of $12.87 billion. Meanwhile, diluted EPS reached $0.87, surpassing the market consensus forecast of $0.82.
Consequently, Netflix achieved a year-over-year (YoY) revenue growth rate of 11.8%, alongside a 47% annual surge in EPS. Notably, the company delivered an operating income of $4.46 billion, translating to an operating margin of 34.6%—a marked improvement over the 28.2% margin reported in Q3 2025.
Looking ahead, management revealed that it expects revenue for the upcoming quarter to reach $13.44 billion, representing a YoY growth rate of 11.5%.
However, despite these solid fundamentals, Netflix's shares fell by 5.31% to close at $65.04. This market reaction appears to stem from an underlying deceleration in revenue growth amidst intensifying competition across the streaming industry.
Financial overview of Netflix Inc.
Netflix's financial statements reflect robust long-term performance across top-line revenue and asset expansion. Revenue maintains a firm upward trajectory, with net income demonstrating similar long-term strength. Over the 2020–2026 period, the average annual revenue growth rate stands at 15.2% (YoY), though growth has moderated over the past two quarters. Furthermore, the net profit margin has remained stable around a historical average of 18%, outperforming this benchmark over the last three consecutive quarters.
Meanwhile, total assets continue on an upward trajectory, indicating that Netflix remains strongly committed to reinvestment funded through healthy operating cash flows. Concurrently, total debt obligations have consistently diminished, driving the debt-to-assets ratio down from 39% to 25% across the analysed period.
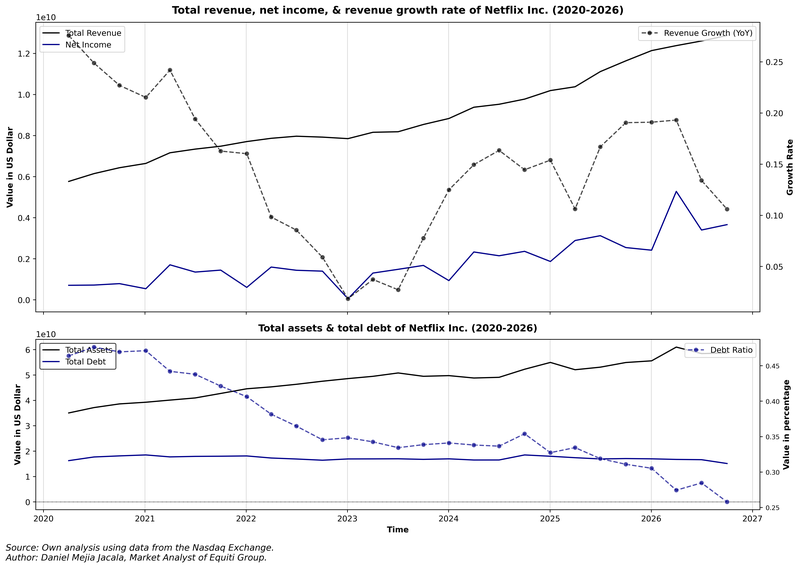
Figure 1. Netflix’s Revenue, Net Income, and Revenue Growth Rate (2020–2026). Source: Author's analysis using data from the Nasdaq Exchange.
Lastly, regarding valuation metrics, price multiples have contracted significantly in recent quarters. The price-to-earnings (P/E) ratio currently stands at approximately 20x, with the price-to-book (P/B) ratio at 9.5x and the price-to-sales (P/S) ratio at 6x. This compression is primarily attributable to a peak-to-trough price drawdown of approximately 51% since the stock reached its all-time high in July 2025.
Technical analysis of Netflix’s share price
From a technical perspective, Netflix’s share price has surrendered its primary bullish trend. Key chart observations include:
- Trend Context: Over the long term, Netflix Inc. has broken its bullish structure of higher highs and higher lows. The share price is currently trading well below its 50-day, 100-day, and 200-day Simple Moving Averages (SMAs), reinforcing prevailing downward pressure and signalling a deterioration in the broader technical framework. Nevertheless, price action is currently testing a significant structural support zone near $65.
- Momentum Indicators: The Moving Average Convergence Divergence (MACD) indicator is exhibiting a bullish divergence, suggesting that the short-term bearish contraction may be exhausting. Concurrently, the Relative Strength Index (RSI) is approaching oversold territory, lending weight to the possibility of a price reversal.
- Resistance Levels: Should the $65 structural support level hold and prompt an upside rebound, the primary technical resistance area lies near $82, followed by a secondary structural resistance ceiling around the $100 psychological threshold.
- Support Levels: If the $65 support level fails to hold, the next key support zone is $61, which coincides with the 61.8% Fibonacci retracement of the preceding bullish impulse. Should this level be breached, the next major technical floor is situated at $45.
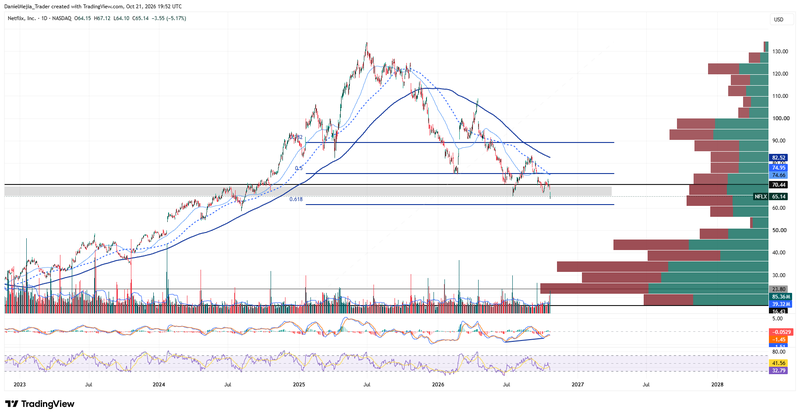
Figure 2. Netflix’s Share Price (2025–2026). Source: Data from the Nasdaq Exchange; author's analysis conducted via TradingView.


