
 Support
 Nvidia falls as higher oil prices pressure sentiment
Nvidia shares fell by nearly 3% to $230.48 as rising crude prices fuelled expectations of a Federal Reserve rate hike, alongside heightened investor scrutiny over the return on investment from massive artificial intelligence infrastructure spending.
Nvidia fell by 2.94% to $230.48 as surging oil prices fuelled expectations of a hawkish Federal Reserve policy stance.
Crude benchmarks jumped by over 3% following comments from US President Donald Trump regarding the ongoing US–Iran conflict.
The CME FedWatch Tool indicated a 69% probability of a Fed interest rate hike at its December meeting.
Date: 9 October 2026
Why are Nvidia shares falling amid rising oil prices?
Shares of Nvidia Corporation declined by 2.94% to $230.48, driven by higher oil prices that escalated expectations of a more hawkish Federal Reserve.
Crude oil benchmarks surged in tandem following comments from US President Donald Trump regarding the ongoing conflict with Iran. At market close, the Brent crude futures contract (BRN) jumped by 4.07% to $104.28 per barrel, whilst the West Texas Intermediate (WTI) futures contract (CL) advanced by 3.72% to $91.50 per barrel.
As reported by Reuters, the US President stated that Washington would not launch an attack against Iran prior to November's mid-term congressional elections. Consequently, energy traders drove crude prices higher, anticipating that the conflict could persist for at least another month. By the end of October, the US–Iran conflict will have reached an eight-month duration.
Following the surge in crude, the CME FedWatch Tool indicated a 69% probability that the US central bank will implement an interest rate hike at the Fed's December meeting—up from 60% in preceding days.
Additionally, market sentiment surrounding artificial intelligence-related equities was weighed down following an investor disclosure by OpenAI, in which the firm reported achieving an annualized revenue of $50 billion at the end of September—as reported by CNBC. Whilst this top-line figure demonstrates solid performance ahead of the company's prospective initial public offering (IPO), market participants are subjecting the sector to rigorous scrutiny regarding the ultimate revenue potential relative to the vast capital deployed into AI infrastructure.
Technical analysis of Nvidia’s share price
From a technical perspective, Nvidia’s primary long-term trend remains fundamentally bullish. A closer examination of the current market structure reveals several key nuances:
- Trend Context: Over an extended horizon, Nvidia maintains a bullish market structure characterised by a consistent sequence of higher highs and higher lows. The shares continue to trade comfortably above their 50-day, 100-day, and 200-day Simple Moving Averages (SMAs), reinforcing the broader upward momentum.
- Resistance Levels: Should the bullish impulse persist, the primary technical ceiling rests at the record high of $239. A decisive breakout above this level could signal entry into a fresh price-discovery phase, possibly towards the psychological barrier of $250.
- Support Levels: If immediate short-term support at $224 is breached, the next structural floor lies at $210, where short-term support converges with the 100-day SMA. Invalidating these levels would elevate the probability of a deeper market correction.
- Momentum Indicators: Both the Moving Average Convergence Divergence (MACD) and the Relative Strength Index (RSI) are trading in neutral territory, reflecting the absence of a clear short-term directional bias. However, the MACD is signalling a bearish divergence when comparing the peaks of May and October, suggesting a potential retracement or consolidation phase for Nvidia’s shares.
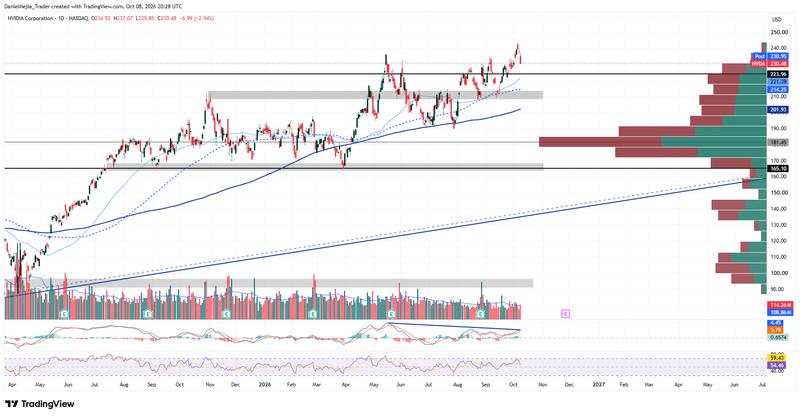
Figure 1. Nvidia’s Share Price (2025–2026). Source: Data from the Nasdaq Exchange; author's analysis conducted via TradingView.


