Support
Nvidia tests key support as negative market sentiment weighs on shares
Nvidia shares approached structural support near $170 following a 25% decline from their October peak, amid heightened corporate and regulatory uncertainty.
Nvidia shares approached structural support near $170 after declining by approximately 25% from their October peak.
The pull-back coincided with media reports concerning CEO Jensen Huang’s reported relationships.
Investors assessed the potential implications for Nvidia’s intellectual property and proprietary technology.
Democratic victories in the US midterm elections raised expectations of tighter regulation surrounding AI data centres.
Date: 10 November 2026 (GMT+3)
Can Nvidia hold key support as market sentiment deteriorates?
Nvidia shares have experienced significant selling pressure in recent days, driving the price to test prominent structural support near $170. This level is particularly relevant as it represents a convergence of structural support, the Volume Profile’s Value Area Low (VAL), and a significant accumulation of traded volume. Since reaching an all-time high in the $239 zone in early October, Nvidia’s market capitalisation has fallen by approximately 25%.
This selling pressure intensified following heightened scrutiny surrounding the firm’s CEO. According to a Reuters report, an internal investigation into Nvidia CEO Jensen Huang was initiated after media reports indicated that he maintained a close relationship with a Chinese businesswoman who allegedly passed information to Beijing. At today’s market close, Nvidia shares fell by 4.27% to $178.67, bringing its market capitalisation to $4.31 trillion.
Against this backdrop, investors have subjected Nvidia’s corporate leadership and share price to increased scrutiny, given the company’s heavy reliance on intangible assets, including proprietary technologies, patents, trade secrets, and specialised technical know-how.
Nevertheless, Nvidia’s board stated that it retains full confidence in Huang, asserting there is no reason to believe that either national security or Nvidia’s trade secrets were compromised, as reported by CNBC.
Additionally, growing uncertainty surrounding leadership in the semiconductor firm has weighed on market sentiment, with investors considering the potential fallout should Nvidia’s CEO be forced to step down. These concerns escalated following reports citing Jensen Huang’s admission of an affair with a purported Chinese spy, as reported by CNBC. Crucially, Beijing has dismissed the allegations as a smear campaign.
Furthermore, Nvidia shares have endured three consecutive sessions of selling pressure following Democratic victories in the US Congress. This stems from growing market apprehension that Democrats may push for tighter regulation of artificial intelligence (AI) infrastructure, particularly data centre projects. Such facilities have faced mounting public opposition in the US due to their heavy consumption of raw materials and local utilities, including water and electricity.
Technical analysis of Nvidia’s share price
From a technical perspective, Nvidia shares are experiencing pronounced short-term selling pressure. A closer examination of the current market structure reveals several key dynamics:
- Trend Context: Over a broader horizon, Nvidia has broken its structure of higher highs and higher lows. The price is currently trading below its 50-day, 100-day, and 200-day Simple Moving Averages (SMAs), reflecting strong short-term bearish pressure. Nonetheless, the price is holding and rebounding off key structural support close to $170.
- Momentum Indicators: The Moving Average Convergence Divergence (MACD) exhibits a downward trajectory with a contracting histogram, signalling that short-term selling pressure may persist. However, the Relative Strength Index (RSI) has entered oversold territory, suggesting caution regarding the sustainability of the bearish momentum.
- Resistance Levels: Should bullish momentum re-emerge, the immediate technical ceiling is $200—a key psychological barrier that aligns with the 200-day SMA. A clean breach above this level would signal a potential price increase towards $239, the previous record high.
- Support Levels: If selling pressure intensifies, the next structural floor lies at $165, aligning with the Volume Profile’s Value Area Low (VAL). A breakdown below this level could trigger a possible decline towards $150—a support zone that converges with a long-term ascending trendline.
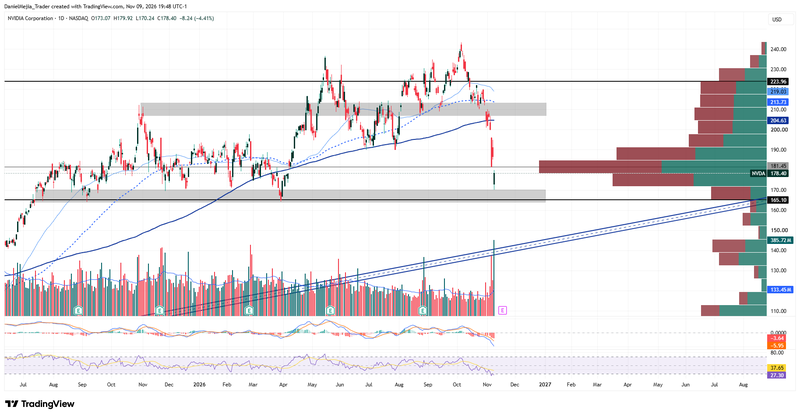
Figure 1. Nvidia’s Share Price (2025–2026). Source: Data from the Nasdaq Exchange; author’s analysis conducted via TradingView.