
 Support
S&P 500 drops more than 3% as semiconductor stocks lead market selloff
S&P 500 futures dropped 3.70% as semiconductor shares led a broad market sell-off driven by scrutiny over artificial intelligence capital expenditure, as well as Federal Reserve interest rate hike expectations.
Rising scrutiny of elevated AI capital expenditure is weighing on semiconductor valuations.
The VIX surged 26.28% whilst the S&P 500 plunged by 3.70% amid AI spending concerns and expectations of a more restrictive Fed stance.
Markets priced in a 91% probability of a December Fed's interest rate hike, pressuring the market capitalisation of US firms.
Reports of a potential SEC accounting investigation have driven further selling pressure on Nvidia shares.
Date: 21 November 2026 (GMT+3)
Is the semiconductor sell-off signalling broader weakness for the S&P 500?
The S&P 500 futures contract (ES) fell by 3.70% to 6,932 amid a sharp sell-off across semiconductor firms. This downturn occurred against a backdrop of heightened scrutiny regarding the sustainability of capital expenditure (Capex) among artificial intelligence (AI)-related companies, as well as their capacity to capitalise on returns from these elevated investments.
Notably, the VIX volatility index surged by 26.28%, reaching 35.90 points. This sharp increase reflects a substantial rise in implied volatility, suggesting heightened market uncertainty and potentially stronger demand for downside protection through options, particularly put contracts.
In this context, the most pronounced declines occurred among semiconductor manufacturers. Advanced Micro Devices dropped by 13.25%, Micron declined by 13.89%, Broadcom fell by 12.19%, and Nvidia plunged by 14.01%. Furthermore, AI-related companies Anthropic and SpaceX fell by 8.50% and 7.69%, respectively.
Crucially, Nvidia faced significant pressure following a Reuters report signalling a possible investigation by the US Securities and Exchange Commission (SEC) into potential accounting irregularities at the firm. Additionally, the Reuters report cited the Wall Street Journal as noting that the SEC was probing Nvidia, though it indicated that the exact focus of the investigation remains unclear.
This controversy has intensified scrutiny of Nvidia following revelations regarding CEO Jensen Huang's extramarital affair with Alice Huang, a former executive at Megaspeed International. The situation has raised concerns over potential conflicts of interest and possible violations of US export controls, amid allegations that Nvidia semiconductors were illegally diverted to China through entities linked to Megaspeed.
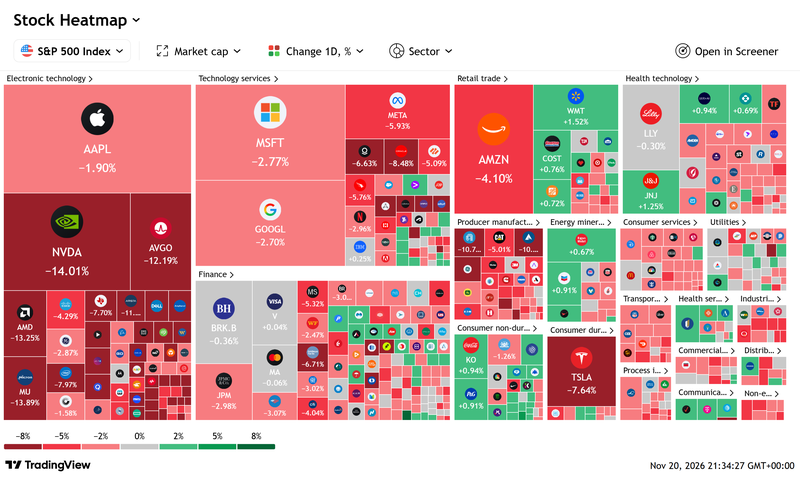
Figure 1. S&P 500 Index Heatmap (20 November 2026). Source: Figure retrieved via TradingView.
Additionally, expectations of a more hawkish monetary policy stance from the Federal Reserve are weighing on US equity markets. According to the CME FedWatch Tool, market-implied probabilities signal a 91% likelihood that the US central bank will raise its benchmark interest rate by 25 basis points at its December meeting, followed by a 57% probability of a subsequent interest rate hike at its January 2027 meeting.
Lastly, it is noteworthy that primary selling pressure was concentrated in semiconductor firms and the broader technology sector. Conversely, sectors such as retail trade, health services, communications, and consumer non-durables posted positive gains. This divergence may signal a broader portfolio rotation, with fund managers shifting allocations towards more defensive sectors.
Technical analysis of the S&P 500 futures contract
From a technical perspective, the S&P 500 is experiencing sharp selling pressure. Key structural observations include:
- Trend Context: On the daily timeframe, the S&P 500 has lost its bullish structure of higher highs and higher lows, currently trading below its 50-day, 100-day, and 200-day Simple Moving Averages (SMAs). This signals a prevailing bearish bias in the short term.
- Momentum Indicators: The Moving Average Convergence Divergence (MACD) oscillator displays a descending trajectory alongside a widening negative histogram, signalling that downward pressure could persist. Conversely, the Relative Strength Index (RSI) is trading in oversold territory, suggesting caution regarding the near-term sustainability of the bearish momentum.
- Bullish Scenario: Should bullish momentum recover, the primary resistance level stands at 7,000 points (a significant psychological barrier), followed by the 7,379 level, where the 200-day SMA lies.
- Bearish Scenario: Should bearish momentum intensify, immediate support rests at 6,812 points—a level that aligns with the Volume Profile's Point of Control (POC). Should this floor be breached to the downside, the next significant technical support lies at 6,400 points.
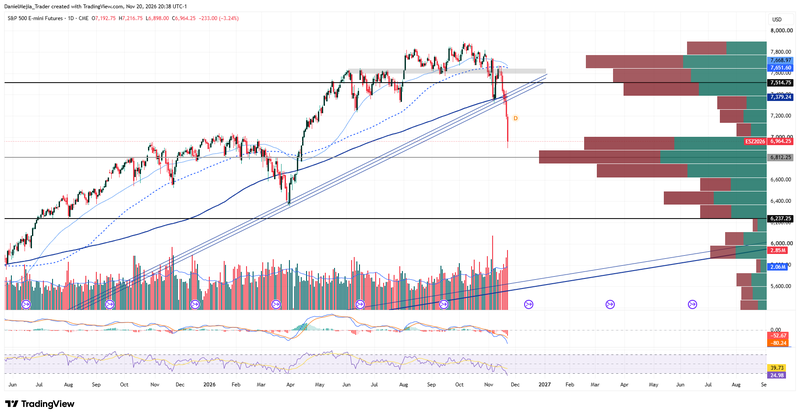
Figure 2. S&P 500 Futures Contract (2025–2026). Source: Data from CME Exchange; author's analysis via TradingView.


