
 Support
 S&P 500 falls after higher-than-expected inflation data and mixed bank results
The S&P 500 declined as higher-than-expected US inflation boosted expectations of further Federal Reserve rate hikes, whilst mixed quarterly earnings from major banks failed to lift broader market sentiment.
S&P 500 futures fell by 1.11% to 7,769 points following higher US headline and core inflation readings.
Energy supply concerns and persistent Middle Eastern tensions have driven a significant surge in fuel prices.
Rate hike expectations escalated, with the CME FedWatch Tool indicating a higher probability of further monetary tightening by the Federal Reserve.
Mixed quarterly earnings from major financial institutions, including Goldman Sachs and JPMorgan, failed to bolster market sentiment.
Date: 15 October 2026
Why is the S&P 500 retreating amid rising inflation pressures?
The S&P 500 futures contract (ES) fell by 1.11% to 7,769 points following a higher-than-expected inflation report, which heightened market expectations that the Federal Reserve will adopt a more restrictive monetary policy stance to curb price pressures. This market reaction can primarily be attributed to the prospect of sustained higher interest rates. Elevated borrowing costs impair corporate expansion and capital investment, whilst higher discount rates apply downward pressure on equity valuations.
According to data released by the US Bureau of Labour Statistics (BLS), headline inflation accelerated from 3.4% in August to 3.7% in September, surpassing consensus analysts' estimates of 3.6%. Concurrently, the BLS report revealed that core inflation—which excludes volatile energy and unprocessed food prices—edged upwards from 2.4% to 2.6%.
This acceleration in consumer prices was primarily driven by a sharp rise in energy costs amidst ongoing geopolitical tensions in the Middle East, which have intensified concerns regarding potential supply chain disruptions. In this context, the BLS report showed that gasoline prices jumped by 34.2% year-on-year (YoY), whilst fuel oil surged by 74.2% YoY. These two components represented the primary catalysts for higher headline inflation—a situation that could worsen if elevated energy costs spill over into the core CPI basket as transportation and logistical expenses are passed on to non-energy goods and services.
On a month-on-month basis, price increases were particularly acute for gasoline and fuel oil, which rose by 9.1% and 15.3% respectively—marking the sharpest monthly increases since May 2026, as reported by CNBC. Fuel oil encompasses diesel and jet fuel, both of which exert a substantial secondary impact on broader consumer prices by raising logistical and transport costs across freight networks, including trucking, rail, and maritime shipping. Furthermore, the conflict in the Middle East has driven up global fertiliser prices, which could place further upward pressure on agricultural commodities and food inflation.
Additionally, economists identify secondary inflationary drivers, including tariffs implemented by the US administration, robust demand for artificial intelligence (AI) infrastructure and hardware, and continued expansion across the services sector. This confluence of factors may compel the Federal Reserve to maintain a tighter monetary policy stance to re-anchor inflation, which has now persisted above the central bank's 2.0% target for more than five years.
The CME FedWatch Tool indicated that the market-implied probability of a Federal Reserve interest rate hike at its October meeting rose to 33%, though an unchanged policy rate remains the baseline scenario with a 67% likelihood. Nevertheless, expectations of policy tightening over the December meeting expanded: the tool signalled a 62% probability of a 25-basis-point rate increase and a 29% likelihood of a larger 50-basis-point hike.
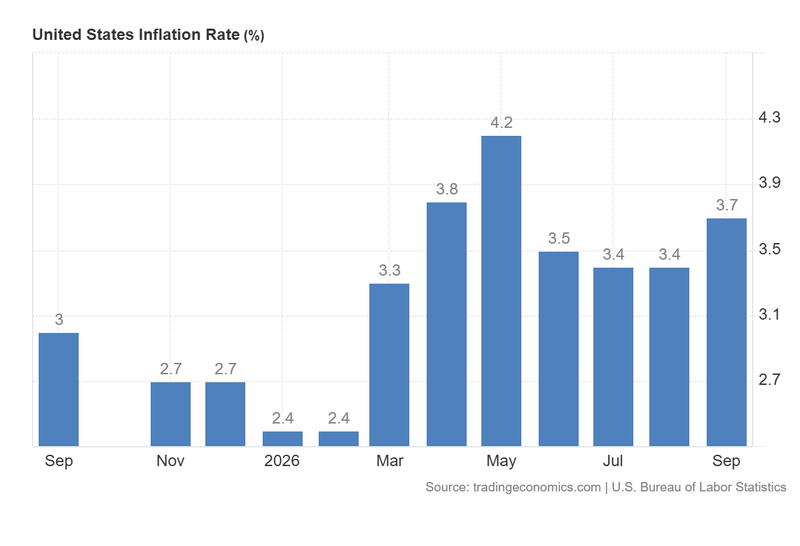
Figure 1. US Inflation Rate (2025–2026). Source: Data from the US Bureau of Labour Statistics; figure retrieved via Trading Economics.
Why are major US bank results failing to foster positive market sentiment in the S&P 500 index?
Concurrently, major US financial institutions reported mixed quarterly earnings, which failed to foster more positive market sentiment as investors remained predominantly focused on persistent inflationary pressures and economic growth risks.
In today's trading session, Morgan Stanley and BlackRock reported better-than-expected revenue and EPS figures, yet equity market reactions were mixed: Morgan Stanley's shares moved lower (-2.75%), whereas BlackRock recorded a modest gain (+0.72%). Furthermore, Bank of America missed forecasts for both revenue and EPS, triggering a sharp decline in its share price (-4.76%) during the session.
Technical analysis of the S&P 500 index
From a technical perspective, the S&P 500 continues to sustain its primary long-term bullish trajectory. Key structural observations include:
- Trend Context: Over the macro horizon, the S&P 500 maintains a robust market structure characterized by a sequence of higher highs and higher lows. The index trades comfortably above its 50-day, 100-day, and 200-day Simple Moving Averages (SMAs), reinforcing the prevailing bullish bias.
- Momentum Indicators: The Moving Average Convergence Divergence (MACD) oscillator displays a bearish divergence, pointing to potential short-term consolidation or a price retracement. Similarly, the Relative Strength Index (RSI) is trending downwards, reinforcing the probability of a near-term pause in the uptrend.
- Bullish Scenario: Should the index maintain its upward momentum, the primary resistance level is the record high of 7,874 points, followed by the psychological threshold at 8,000 points. A sustained breakout above this level would increase the likelihood of further extension into uncharted territory.
- Bearish Scenario: In the event of a pullback, immediate support rests at 7,600 points, followed by 7,300 points—a level that aligns closely with the 200-day SMA. A decisive break below these levels would substantially raise the probability of a broader corrective phase.
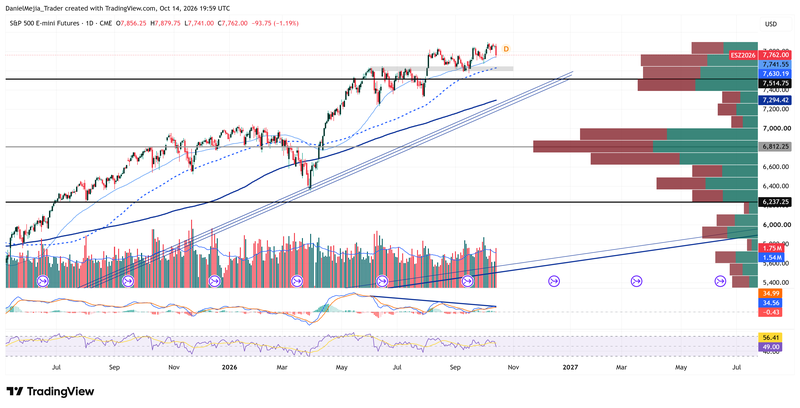
Figure 2. S&P 500 Futures Contract (2025–2026). Source: Data from CME Exchange; author's analysis conducted via TradingView.


