
 Support
 Tesla shares surge after Q3 vehicle deliveries beat expectations
Tesla shares rose 5.20% to $372.53 following the release of its third-quarter 2026 vehicle delivery figures, which reached 486,532 units and surpassed market consensus by 5.3%. Investors now await the company's Q3 financial earnings report scheduled for release on 21 October.

Tesla’s vehicle deliveries reached 486,532 units, beating analyst consensus estimates by 5.3%.
Despite a 2.1% year-on-year decline, Q3 deliveries achieved a quarter-on-quarter growth rate of 1.3%.
Vehicle deliveries serve as the primary proxy for estimating total revenue ahead of the Q3 earnings report on 21 October.
Date: 2 October 2026
Can stronger-than-expected Q3 deliveries sustain Tesla's bullish momentum?
Tesla Inc. published its vehicle delivery and production figures for the third quarter of 2026, exceeding the consensus estimates outlined in its company-compiled "Q3 2026 Delivery Consensus" report. The company reported total Q3 vehicle deliveries of 486,532 units alongside total vehicle production of 464,391 units—as quoted by CNBC. In contrast, analysts had anticipated 461,974 deliveries, yielding a positive surprise of approximately 5.3% relative to forecasted values. Notably, while the latest delivery figures represent a 2.1% year-on-year (YoY) decline, they reflect a quarter-on-quarter expansion of 1.3%.
Consequently, market participants appear to have interpreted these stronger-than-expected figures and quarterly delivery growth favourably, with Tesla's shares appreciating by 5.20% to close at $372.53 during the trading session.
Although vehicle delivery data does not provide a deterministic calculation of total revenue, it serves as a highly reliable proxy when evaluated alongside the average selling price per vehicle. Against this backdrop, these underlying operational metrics are closely monitored by investors seeking to project total revenue ahead of Tesla's Q3 financial results, scheduled for release after market close on 21 October.
Additionally, it is worth noting that Tesla publishes both its compiled delivery consensus and its actual production and delivery reports to provide market participants with transparency regarding the performance of its underlying operational drivers.
Technical analysis of Tesla’s share price
Regarding the technical outlook, Tesla has experienced a downward trajectory year-to-date, although short-term bullish momentum is currently strengthening. The following analysis highlights key developments in price action performance:
- Trend Context: Over the long term, Tesla Inc. maintains a market structure defined by a sequence of "higher highs" and "higher lows". Nevertheless, year-to-date, Tesla’s shares have experienced a downward trajectory, with the price trading below its 100-day and 200-day Simple Moving Averages (SMAs). Meanwhile, over the last two months, price action has exhibited strengthening bullish momentum, approaching key technical resistance levels.
- Resistance Levels: Should the short-term bullish momentum persist, the next significant resistance lies at $394—a descending trendline that converges with the 200-day SMA. A decisive close above this level would increase the likelihood of tests toward higher valuation levels, notably the $433 zone, which coincides with the Volume Profile’s Point of Control (POC).
- Support Levels: Should the bearish impulse reassert itself, a key technical support level stands at $347. A downside breach of this threshold would expose the next critical support area at $320. Failure to hold these zones would heighten the probability of a deeper market correction.
- Momentum Indicators: Both the Moving Average Convergence Divergence (MACD) and the Relative Strength Index (RSI) are trading near neutral levels, reflecting the absence of a dominant trend. However, the MACD is exhibiting a potential bullish crossover that could signal accelerating short-term momentum if the price surpasses key technical resistance levels ahead periods.
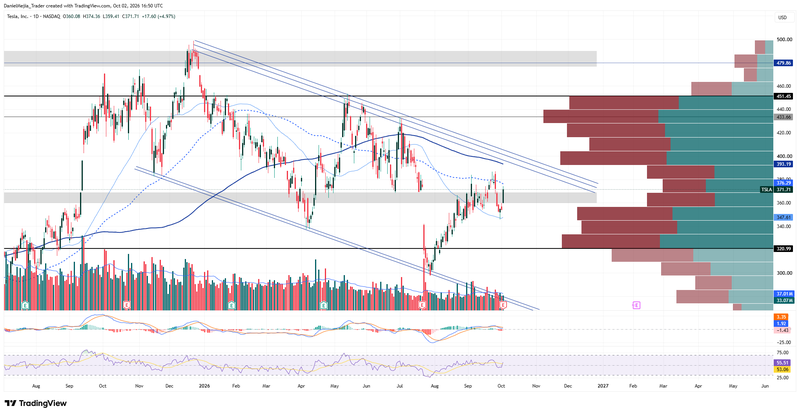
Figure 1. Tesla’s Shares (2025–2026). Source: Data from the Nasdaq Exchange; author's analysis conducted via TradingView.


