
 Support
 10-year Treasury yield reaches multi-year high as US dollar strengthens
The 10-year US Treasury yield has reached the 5.0% mark amid persistent inflationary pressures and mounting sovereign debt concerns. Concurrently, elevated yields and geopolitical safe-haven demand have pushed the US dollar index upwards.

The US 10-year Treasury yield reached 5.0%, hitting its highest level since 2007 amidst sustained selling pressure in secondary markets.
Financial markets are pricing in a 94.5% probability of a 25-basis-point Federal Reserve rate hike, despite political pressure from the US administration to lower borrowing costs.
US national debt has surpassed $40 trillion, with annualised net interest outlays escalating to $1.25 trillion in Q2 2026.
Intensifying geopolitical safe-haven demand alongside attractive benchmark yields continues to bolster the US dollar.
Date: 15 September 2026
Why are US government bond yields rising to multi-year highs?
The 10-year US Treasury yield reached the 5.0% threshold, hitting a level not observed since June 2007. This upward trajectory has been primarily driven by two key factors: persistent inflationary pressures, which have heightened expectations of a more restrictive monetary policy stance by the Federal Reserve, and growing concerns surrounding US sovereign debt, which is driving substantial net interest expenses. Consequently, bondholders have exerted persistent selling pressure, pushing secondary market yields higher in accordance with the inverse relationship between bond prices and yields.
Against this backdrop, market participants are anticipating a potential interest rate increase at tomorrow's Federal Reserve meeting. According to the CME FedWatch Tool, the market-implied probability indicates a 94.5% likelihood that the Fed will raise its benchmark interest rate by 25 basis points, bringing the target rate to the 4.0% level. However, uncertainty remains regarding how Federal Open Market Committee (FOMC) members will respond amidst escalating pressure from the US administration to reduce interest rates—a stance driven by the expanding burden of net interest payments on the federal fiscal deficit.
Meanwhile, US national debt has breached the $40 trillion threshold, while annualised net interest payments reached $1.25 trillion in Q2 2026, according to data from the Federal Reserve Bank of St. Louis (FRED). Consequently, net interest outlays have surpassed expenditures on defence as well as some major social programmes. This combination of elevated sovereign debt and high benchmark interest rates presents a complex environment, engendering caution among bondholders as concerns grow regarding the long-term sustainability of US fiscal commitments.
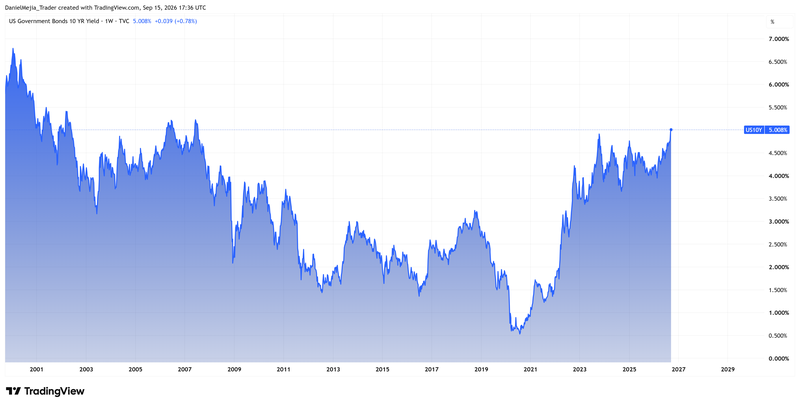
Figure 1. US Government Bonds 10 YR Yield (2000–2026). Source: Chart obtained via TradingView.
What is happening with the US dollar index?
The US Dollar Index (DXY) is undergoing a period of appreciation, potentially given that international investors seek the greenback to secure liquidity for purchasing US Treasury securities. These sovereign bonds offer increasingly attractive yields should the Federal Reserve adopt a more hawkish monetary stance. Because these debt instruments are denominated in US dollars, capital flows into Treasuries directly boost demand for the currency, driving up its valuation.
Additionally, the US dollar has historically served as a safe-haven asset during periods of international turmoil. This safe-haven appeal is providing complementary support for the greenback amidst widespread economic and geopolitical instability. Tensions in the Middle East have intensified following ongoing hostilities between the US and Iran, coupled with direct interventions by Houthi forces in the Bab el-Mandeb Strait. These developments have heightened fears that regional energy supply disruptions could escalate, further compounding global inflationary pressures.
Technical perspective of the dollar index (DXY)
From a technical standpoint, the US Dollar Index exhibits short-term market consolidation while maintaining underlying structural strength. Key technical observations include:
- Trend Context: Over the medium term, the index remains within a range-bound structure. Nevertheless, price action continues to trade comfortably above its 200-day Simple Moving Average (SMA), indicating that a bullish bias remains predominant in the near term. Notably, price action is currently bouncing off a key confluence of support comprising the 200-day SMA, a long-term ascending trendline, and a short-term 50.0% Fibonacci retracement level.
- Resistance Levels: To the upside, the 100.00 mark represents a major technical hurdle and psychological threshold. A decisive breakout above this barrier could shift focus towards the 101.50 handle. A sustained move beyond these levels would signal a potential transition into a higher trading range, probably the secondary resistance near 104.00.
- Support Levels: On the downside, should a market retracement occur, primary structural support is located at 98.60. A breakdown beneath this floor would bring the next key technical area of interest at 97.90 into focus. A sustained break below these levels would likely trigger a deeper bearish correction.
- Momentum Indicators: Both the Moving Average Convergence Divergence (MACD) and the Relative Strength Index (RSI) are sloping upwards and displaying bullish divergences, suggesting that short-term upward momentum could persist. Nonetheless, macroeconomic and geopolitical factors remain the primary drivers of broader price direction.
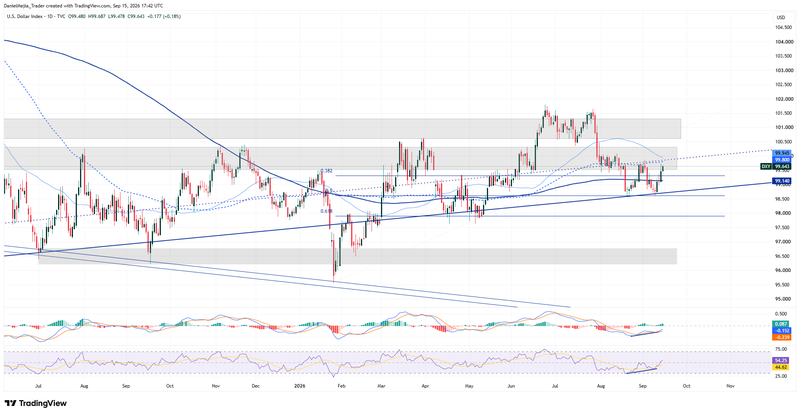
Figure 2. Dollar Index (2025–2026). Source: Intercontinental Exchange (ICE) data; author's analysis via TradingView.


