Support
 AUD/USD advances as inflation exceeds market expectations
The AUD/USD pair rose to 0.7174 after Australian inflation decelerated less than expected to 3.5%.

Australia's July inflation rate eased to 3.5%, exceeding the 3.3% market forecast and providing support for the AUD.
The Reserve Bank of Australia (RBA) may adopt a neutral stance, balancing a 10-year high interest rate of 4.35% against a rising unemployment rate and an easing inflation.
Technical indicators reflect strong bullish momentum, although the Relative Strength Index (RSI) signals caution as it approaches overbought territory.
Date: 26 August 2026
AUD/USD rises amid an upside inflation surprise
According to data published by the Australian Bureau of Statistics, headline inflation decelerated from 3.8% in June to 3.5% in July, representing a slower-than-expected easing relative to the 3.3% consensus forecast by analysts. Analysis from Trading Economics suggests that this deceleration stemmed from moderating price pressures across goods, services, and housing. Conversely, transport inflation accelerated during the period.
Consequently, the Reserve Bank of Australia (RBA) may adopt a neutral stance at its upcoming monetary policy decision. This reflects a balancing act: whilst the latest labour market data revealed a rise in unemployment to 4.5%—signalling softening in the employment sector—underlying inflationary pressures have continued to ease. The Australian central bank currently maintains its benchmark interest rate at 4.35%, its highest level in a decade.
Following the economic release, the Australian dollar advanced by 0.19% against the US dollar. At market close, the AUD/USD pair traded at 0.7174, sustaining its ongoing upward momentum.
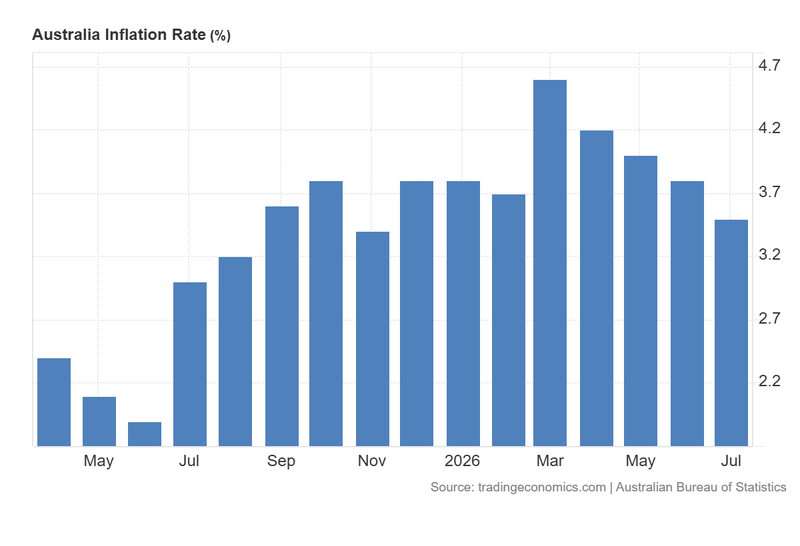
Figure 1. Australian Inflation Rate (2025–2026). Source: Data from the Australian Bureau of Statistics; chart retrieved via Trading Economics.
Technical analysis of the AUD/USD pair
From a technical perspective, the AUD/USD pair continues to trade within an established bullish trajectory. Key technical observations include:
- Trend Context: The AUD/USD pair maintains a long-term bullish structure, characterised by a consistent sequence of higher highs and higher lows. Price action remaining above the 50-, 100-, and 200-day Simple Moving Averages (SMAs) reinforces this underlying upward trajectory.
- Resistance Levels: Should the pair sustain its upward momentum, immediate resistance is located at 0.7200, with the next major technical hurdle residing at the structural resistance ceiling of 0.7270. A decisive daily close above this pivot point would suggest renewed bullish momentum targeting higher valuation zones.
- Support Levels: If short-term support at 0.7047—a level that converges with the Volume Profile’s Point of Control (POC)—is breached to the downside, the next key demand zone is found at 0.6965, aligned with the 200-day SMA. A decisive breakdown below these levels would significantly increase the probability of a deeper market correction.
- Momentum Indicators: Both the Moving Average Convergence Divergence (MACD) and the Relative Strength Index (RSI) display ascending trajectories, indicating that short-term bullish momentum could persist. Nevertheless, the RSI is nearing overbought territory, suggesting caution regarding the continuation of this bullish impulse.
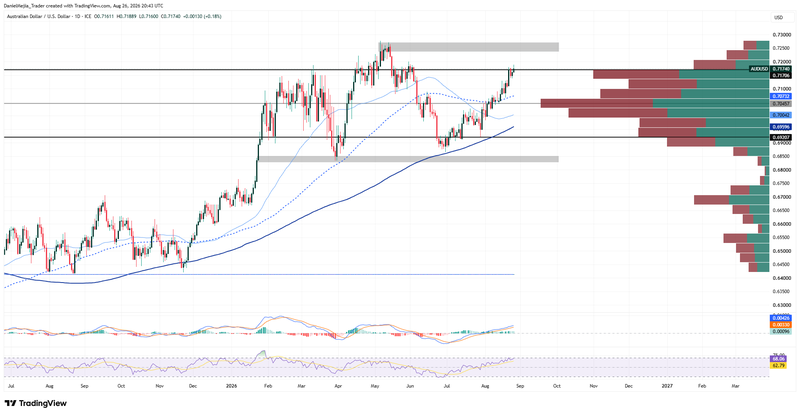
Figure 2. AUD/USD Exchange Rate (2025–2026). Source: Data from the Intercontinental Exchange (ICE); author's analysis conducted via TradingView.