Support
Brent slides amid optimism over a potential US-Iran conflict resolution
Brent crude fell by 5.94% to $92.52 amid potential progress in US–Iran diplomacy.

Potential US–Iran conflict resolution and midterm election results weighed heavily on oil prices.
Statements ruling out new strikes and Qatari mediation reinforced market optimism.
Easing regional supply flows coupled with weak global demand could be creating an excess market supply.
Output from OPEC members expanded by 1.38 million bpd, adding further downward pressure.
Date: 10 November 2026 (GMT+3)
Can a potential US–Iran deal drive Brent prices lower?
The Brent crude futures contract (BRN) plunged by 5.94% to $92.52 per barrel at market close, amid renewed hopes that the United States and Iran could achieve a diplomatic resolution to their conflict.
Notably, Brent crude futures recorded a decline of approximately 12% following the US midterm elections, in which Democrats secured control of both the Senate and the House of Representatives. This political shift has fuelled market expectations of a potential diplomatic resolution between Washington and Tehran, as Democratic control of Congress could increase political pressure on the Trump administration and constrain military funding, thereby encouraging a negotiated settlement.
Furthermore, according to a Reuters report, US President Donald Trump stated that he was unlikely to order fresh strikes against Iran while talks to end the conflict progressed. He added that he would meet with the Prime Minister of Qatar—a nation serving as a mediator between the two countries—reinforcing hopes for a resumption of diplomatic dialogue.
Meanwhile, oil flows across the region have improved considerably over recent weeks, despite the Strait of Hormuz not being officially declared open and ongoing tensions between Saudi Arabia and the Houthi movement persisting.
Against this backdrop, energy analysts have highlighted a growing imbalance in the global oil market, as recovering crude production and exports coincide with weakening demand amid persistently high energy prices.
According to JPMorgan, as cited by Reuters, the global oil market recorded an estimated surplus of 1.4 million barrels per day (bpd) in October, signalling a return to excess supply. This trend was further corroborated by OPEC production figures, with crude output across its 11 member states expanding by 1.38 million bpd month-on-month to reach 22.87 million bpd in October, according to a Reuters survey.
Technical analysis of the Brent futures contract
From a technical perspective, the Brent crude futures contract exhibits a robust short-term bearish impulse. A detailed examination of the underlying market structure highlights several critical dynamics:
- Trend Context: Over recent months, the Brent contract has transitioned into a highly volatile pricing regime. Nevertheless, from a structural standpoint, price action has reflected significant short-term selling pressure, with prices trading below the 50-day and the100-day Simple Moving Averages (SMAs). Notably, the price is breaching the 200-day SMA to the downside, reinforcing the bearish bias.
- Momentum Indicators: The Moving Average Convergence Divergence (MACD) indicator continues to trend downwards while the histogram contracts further, signalling that short-term bearish momentum could persist. However, the Relative Strength Index (RSI) is approaching oversold territory; although it remains above the 30-point threshold, it is currently trading at 34.
- Resistance Levels: Should bullish momentum regain strength, the primary technical resistance ceiling is positioned at $100.00—a significant psychological barrier that converges with the Volume Profile's Point of Control (POC). A decisive breakout above this mark would bring the secondary resistance level at $112.00 into focus, where the Volume Profile's Value Area High (VAH) resides.
- Support Levels: If short-term selling pressure intensifies, key downside support levels are situated at $90.00 (a prominent psychological barrier) and $81.50 per barrel (the Volume Profile's Value Area Low).
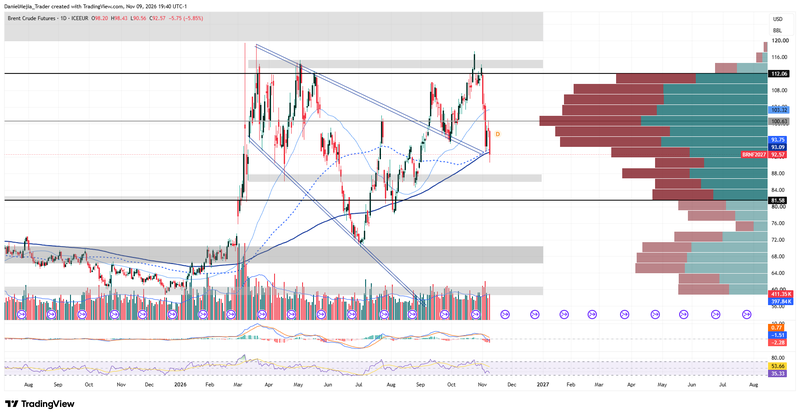
Figure 1. Brent Futures Contract (2025–2026). Source: Data from ICE Futures Europe; author's analysis conducted via TradingView.