Broadcom shares drop even after quarterly earnings report tops expectations
Broadcom shares fell sharply despite beating quarterly revenue and EPS estimates, as investors were disappointed by weaker-than-expected momentum in its custom artificial intelligence (AI) business. Management nevertheless remained confident in supply-chain stability and in the company’s AI chip development plans. Fundamentally, growth remains strong.

Broadcom stock fell 12.59% to $418.91, as investors focused on softer-than-expected prospects for its custom AI business despite the earnings beat.
Quarterly results exceeded forecasts: revenue reached $22.19 billion and EPS came in at $2.44, with strong year-on-year growth in both sales and profitability.
Management highlighted stable chip supply chains and ongoing efforts to strengthen AI chip capabilities through 2027.
Broadcom shares tumble despite earnings surprise
Broadcom Inc.’s shares fell by 12.59% at market close to $418.91, as the company did not meet investors’ expectations regarding its custom artificial intelligence (AI) business, according to Reuters. However, Broadcom’s management remains comfortable with current performance, as the technology giant continues to report stability across its chip supply chain and is working to improve the broader capabilities of its AI chips by 2027.
Notably, Broadcom surpassed analysts’ expectations for both total revenue and earnings per share (EPS). The company reported revenue of $22.19 billion, exceeding analysts’ estimates of $22.13 billion. In turn, Broadcom posted earnings per share of $2.44, above the market consensus estimate of $2.40. These results imply a year-on-year (YoY) growth rate of 47.9% in total revenue and a YoY increase of 54.4% in EPS, signalling a notable expansion within the technology sector.
Additionally, the company’s revenue and net income performance remain healthy and robust. The figure below shows that the YoY growth rate has improved, reflecting an upward trajectory. The mean revenue growth rate stands at 20%, and performance has remained above this average level since Q2 2025. Broadcom’s revenue therefore continues to demonstrate both growth and consistency.
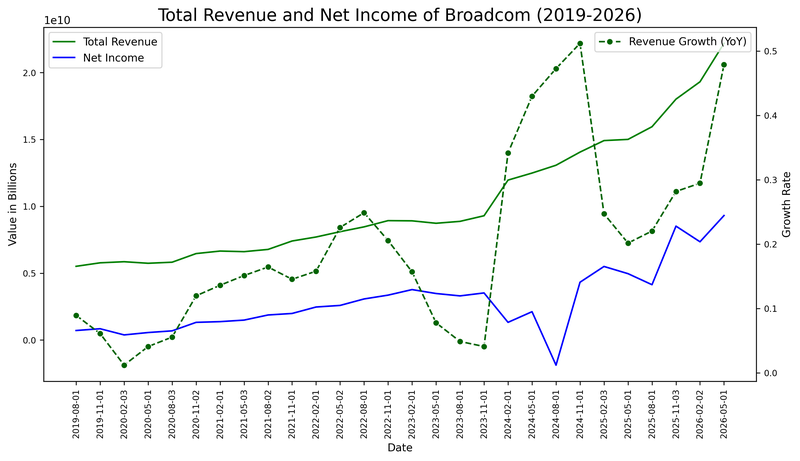
Figure 1. Broadcom’s Revenue, Net Income, and Revenue Growth Rate (2019–2026). Source: Own analysis using data from the Nasdaq Exchange.
Technical analysis of Broadcom’s share price
From a technical perspective, Broadcom’s primary long-term trend remains fundamentally bullish. A closer inspection of the current market structure reveals several important nuances:
- Trend context: Over a longer horizon, Broadcom retains a healthy bullish market structure, characterized by a disciplined sequence of higher highs and higher lows. The shares continue to trade comfortably above their 50-day, 100-day, and 200-day simple moving averages (SMAs), reinforcing the underlying bullish impulse. Nevertheless, short-term momentum indicators point to a retracement from elevated levels.
- Resistance levels: Should the immediate support at $410 hold, the next relevant technical level is $480, which marks the record high. A decisive breakout above this level would signal a transition into a new phase of price discovery.
- Support levels: If the immediate short-term support at $410 is invalidated, the next structural floor is located at $365, a critical convergence zone for both the 100-day and 200-day SMAs. A breach of this $365 support area would significantly increase the probability of a deeper market correction.
- Momentum indicators: Both the Moving Average Convergence Divergence (MACD) and the Relative Strength Index (RSI) remain in overbought territory, indicating that a short-term retracement or an extended consolidation phase could occur. Notably, the MACD is currently displaying a bearish divergence from historically elevated levels, confirming waning short-term buying pressure.
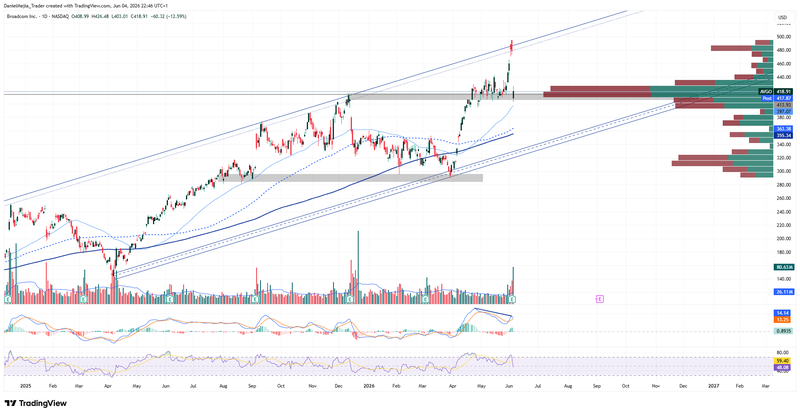
Figure 2. Broadcom’s Share Price (2025–2026). Source: Data from the Nasdaq Exchange; own analysis conducted via TradingView.


