
 Support
 Canadian dollar falls modestly as inflation exceeds forecasts
The Canadian dollar slipped slightly despite higher-than-expected July inflation, driven by surging gasoline prices. Investors are now monitoring Middle East geopolitics and key technical levels for the future direction of USD/CAD.
Canada’s July headline Consumer Price Index (CPI) rose to 3.0%, exceeding expectations due to a 25.7% spike in gasoline costs.
Core inflation grew from 2.1% to 2.3%, remaining within the Bank of Canada’s target boundary.
Ongoing US–Iran geopolitical friction threatens further energy supply disruptions and upside price risks if it persists.
Date: 17 August 2026
Canadian dollar depreciates marginally after inflation tops expectations
According to data released by Statistics Canada, the country’s headline annual inflation rate accelerated from 2.8% in June to 3.0% in July, surpassing analysts’ expectations of 2.9%. Analysis from Trading Economics signals that this acceleration was primarily explained by an increase in gasoline prices, which rose by 25.7%, up from the previous reading of 20.5%. Meanwhile, the core inflation rate—which excludes the most volatile components of energy and unprocessed food—advanced from 2.1% to 2.3% over the same period.
While this acceleration remains relatively controlled inside to the Bank of Canada’s 1%–3% target range, it may nevertheless be viewed as a warning sign of rising prices amid an upward trajectory (see figure 1). Market participants are now focused on the ongoing US–Iran conflict in the Middle East, which could exert upward pressure on inflation levels should energy supply disruptions persist—particularly under a scenario where geopolitical tensions endure.
Following the inflation release, the Canadian dollar depreciated marginally by 0.02% against the US dollar to trade at 1.3875, after the USD/CAD pair attempted to drop before encountering a key support level within its price action structure. Additionally, inflationary pressures appear more pronounced for the US Federal Reserve than for the Bank of Canada, a scenario that could provide greater support to the US dollar relative to the Canadian currency.
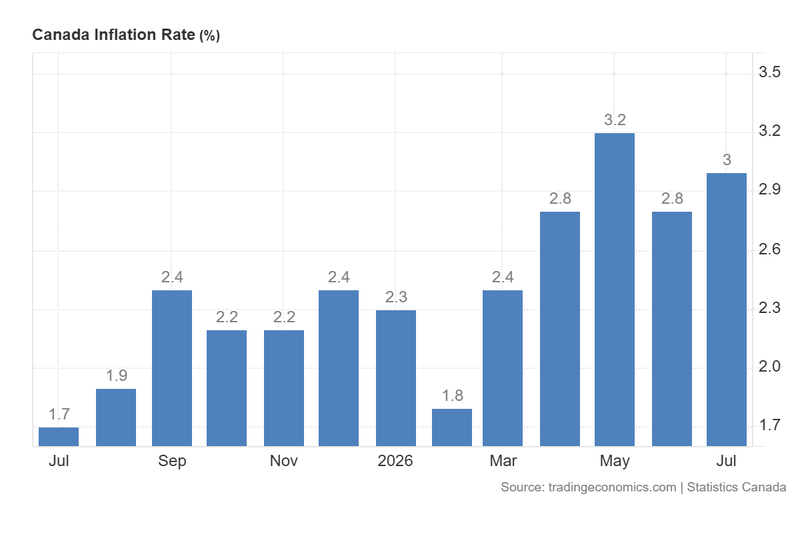
Figure 1. Canada Inflation Rate (2025–2026). Source: Data from Statistics Canada; chart obtained from Trading Economics.
Technical analysis of the USD/CAD pair
From a technical perspective, the USD/CAD pair has exhibited a short-term bearish performance over recent weeks. Key structural observations include:
- Trend Context: While the USD/CAD pair has developed a downward trajectory over recent weeks, the price is currently respecting and rejecting its 200-day simple moving average (SMA), thereby maintaining an underlying bullish bias.
- Resistance Levels: If price action respects and rejects the 1.3845 level to the upside—a zone where the 200-day SMA and the 61.8% Fibonacci retracement level converge—the next major technical ceiling is identified at 1.3950. A decisive breakout above this zone would signal the potential for an extended rally into higher price territories, notably the 1.4120 level.
- Support Levels: If the 1.3845 level is invalidated to the downside, the next relevant support floors rest at 1.3775 and 1.3560. A structural break below these support levels would significantly increase the probability of a deeper market correction.
- Momentum Indicators: Both the Moving Average Convergence Divergence (MACD) and the Relative Strength Index (RSI) are currently trading deep within oversold territory, signalling a potential market reversal. However, fundamental drivers are expected to lead the future market trajectory.
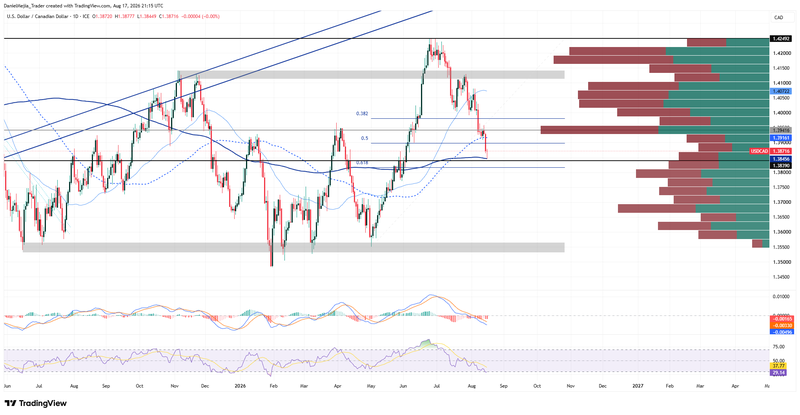
Figure 2. USD/CAD Pair (2025–2026). Source: Data from the Intercontinental Exchange (ICE); author's analysis conducted via TradingView.


