Dow Jones declines as strong economic data reinforces hawkish Fed expectations
The Dow Jones fell 1.21% to 50,692 as strong US employment and services data signalled economic resilience. Combined with a sharp drop in US crude inventories that pushed oil prices toward $97, rising inflation risks have lowered rate-cut expectations, driving fears of a more restrictive Federal Reserve stance later in 2026.

Strong ADP private payroll additions (122,000) and an advancing ISM Services PMI (54.5) underscore the robust health of the US economy, reducing the immediate justification for interest rate cuts.
US crude oil inventories plunged by 7.97 million barrels amidst ongoing geopolitical disruptions in the Middle East, driving Brent and WTI futures higher and compounding inflationary concerns.
The CME FedWatch Tool indicates a 41.7% probability of an interest rate hike by December 2026, while the likelihood of near-term cuts remains minimal.
Despite a long-term bullish trend above major SMAs, overbought MACD and RSI levels indicate the Dow could face a short-term correction or consolidation phase.
US ADP employment change and ISM services PMI surpass forecasts, signalling economic strength
The Dow Jones Industrial Average underwent a market retracement following a series of robust economic releases in the United States. These prints have heightened expectations that the Federal Reserve will maintain its "higher-for-longer" monetary policy stance, or potentially implement further rate hikes to counteract renewed inflationary pressures. Reflecting this cautious market sentiment, the blue-chip index depreciated by 1.21% to settle at 50,692 points.
According to data compiled by Automatic Data Processing (ADP) Inc., private-sector employment growth accelerated from 105,000 positions in April to 122,000 in May, marking its highest level since January 2025 and comfortably exceeding the consensus forecast of 117,000. The breakdown of the ADP report highlights that the primary drivers of job creation were "Education and Health Services," which added 57,000 positions, and "Trade, Transportation, and Utilities," which expanded by 36,000. Conversely, the information sector recorded a contraction of 9,000 roles.
Concurrently, the Institute for Supply Management (ISM) reported that the Services PMI rose from 53.6 in April to 54.5 in May, surpassing analyst expectations of 53.8. Because this composite index remains well above the critical 50.0 threshold, the data confirms sustained expansion within the service sector. When paired with the robust Manufacturing PMI released earlier in the week, these data points illustrate highly resilient industrial and commercial productivity across the US economy. In summary, both indicators signal a robust economic backdrop, thereby diminishing the immediate necessity for interest rate cuts and allowing the Federal Reserve to remain squarely focused on curbing inflation.
Rising energy prices add concerns that the Fed will maintain a restrictive stance
The US Energy Information Administration (EIA) reported a steep decline in commercial crude oil inventories in its weekly assessment, with stockpiles falling by 7.97 million barrels. This significant draw suggests an escalation in demand, amplified by severe energy supply disruptions in the Middle East. These regional tensions have driven international buyers—particularly European nations heavily dependent on Middle Eastern supply—to increase their procurement of US crude. The contraction was far more pronounced than the consensus forecast, which had anticipated a 4-million-barrel decline, and surpassed the previous week's draw of 3.33 million barrels.
As a consequence of this contracting supply environment, global oil benchmarks advanced firmly. The Brent crude futures contract (BRNQ6) gained 1.89% to reach $97.81 per barrel, while the West Texas Intermediate (WTI) futures contract (CLN6) appreciated by 2.41% to settle at $96.02 per barrel. Elevating energy costs threaten to feed into broader inflationary metrics, creating substantial complications for the Federal Reserve’s upcoming monetary policy decisions. According to pricing data from the CME FedWatch Tool, the implied probability of a 25-basis-point interest rate hike at the December 2026 meeting has risen to 41.7%, while the probability of near-term rate cuts has been effectively minimised.
Technical analysis of the Dow Jones index
From a technical perspective, the Dow Jones continues to navigate within a well-defined long-term bullish framework. A detailed assessment of the current chart structure yields several critical observations:
- Trend Context: Over a multi-month horizon, the index maintains a classic market structure defined by a sequence of higher highs and higher lows. Crucially, the index continues to trade comfortably above its 50, 100, and 200-period Simple Moving Averages (SMAs), confirming that the primary trend remains structurally intact. However, short-term oscillators indicate that the market has moved deep into overextended territory.
- Resistance Levels: Should the index achieve a decisive upside breakout above immediate resistance at 51,300 (the recent historical high), the next relevant ceiling is the major psychological barrier at 52,000. A sustained close above this ceiling would signal a formal continuation of the secular bull market into uncharted territory.
- Support Levels: On the downside, immediate structural support is identified at the 50,500 level. A failure to maintain this floor would bring the key 49,000 support zone into focus, which aligns with the upper boundary of the long-term ascending trendline. A breach of this 49,000 pivot would significantly increase the probability of a more profound structural correction.
- Momentum Indicators: Both the Moving Average Convergence Divergence (MACD) and the Relative Strength Index (RSI) are presently trading within overbought parameters. These elevated readings suggest that the immediate upward momentum may be exhausted, increasing the likelihood of a short-term technical retracement or a temporary consolidation phase.
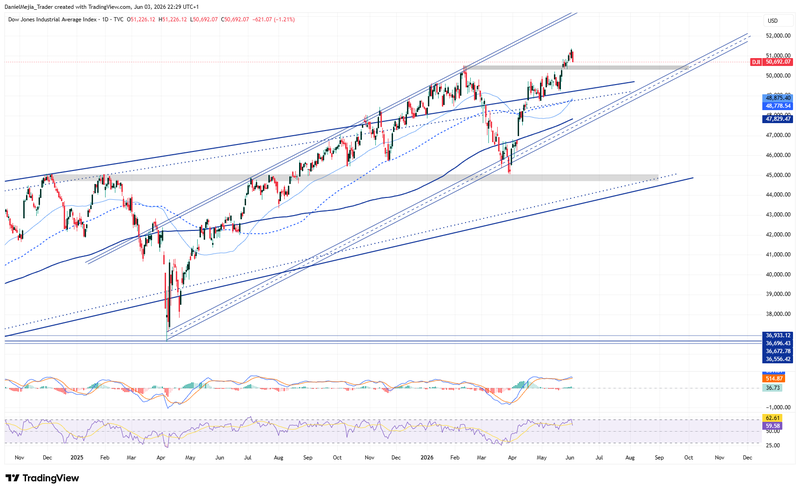
Figure 1. Dow Jones Index (2025-2026). Source: Own analysis conducted via TradingView.


