
 Support
 Dow Jones hits record high amid softer nonfarm payrolls
The Dow Jones reached a fresh record high as softer US payrolls reduced expectations of near-term Federal Reserve tightening, supporting rotation into non-technology equities. Payrolls slowed sharply to 57,000, while unemployment fell to 4.2%.
The Dow Jones rose by 1.14% to a record 52,905, as weaker payrolls reduced expectations of near-term Federal Reserve tightening.
US non-farm payrolls slowed to 57,000 in June, well below forecasts of 110,000 and the weakest pace since February 2026.
Unemployment fell to 4.2%, but markets focused on weaker job creation, shifting Fed rate-hike expectations towards October.
From a technical perspective, the Dow remains bullish above key SMAs, although an overbought RSI and MACD suggest the risk of consolidation.
Dow Jones climbs to record high despite easing US job growth
The Dow Jones Industrial Average reached a new record high as investors reduced expectations that the Federal Reserve would adopt a more restrictive monetary policy stance in upcoming meetings, following a significant slowdown in US job creation. The index advanced by 1.14% to 52,905 points, diverging from the broader market. The S&P 500 remained broadly unchanged, while the Nasdaq 100 fell by 1.61%, reflecting growing concerns over elevated valuations among technology and artificial intelligence-related companies.
According to data released by the US Bureau of Labor Statistics (BLS), non-farm payrolls increased by 57,000 in June, down from a revised 129,000 in May and well below analysts’ expectations of 110,000. The June figure represented the weakest pace of job creation since February 2026, signalling a moderation in labour-market momentum. At the same time, the unemployment rate declined from 4.3% to 4.2%, below market expectations for an unchanged reading.
Consequently, the CME FedWatch Tool reflected a reassessment of interest rate expectations. Market-implied probabilities indicated that a 25-basis-point rate increase at the October Federal Reserve meeting had become the most likely outcome, with a probability of 45.9%. This marked a shift from earlier expectations that a rate hike could occur in September, suggesting that market participants assigned greater importance to the sharp slowdown in payroll growth than to the decline in the unemployment rate.
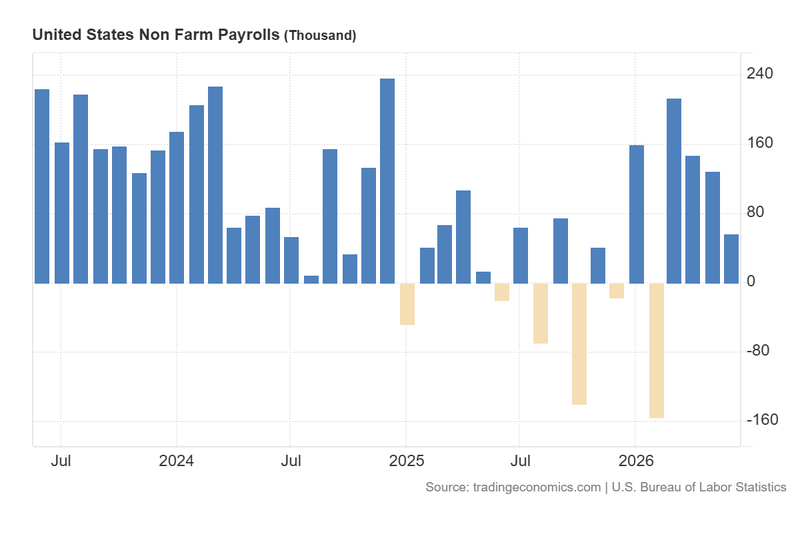
Figure 1. US Non-Farm Payrolls (2023–2026). Source: Data from the US Bureau of Labor Statistics; figure obtained from Trading Economics.
Technical analysis of the Dow Jones index
From a technical perspective, the Dow Jones continues to move within a well-defined long-term bullish framework. A detailed assessment of the current chart structure yields several key observations:
- Trend context: Over the long term, the index maintains a classic market structure defined by a sequence of higher highs and higher lows. Crucially, it continues to trade comfortably above its 50-day, 100-day, and 200-day Simple Moving Averages (SMAs), confirming that the primary trend remains structurally intact.
- Resistance levels: Should the index continue its bullish momentum, the immediate significant resistance level is 54,000, while a second important ceiling is located at the 55,000 mark. A sustained close above this level would signal a formal continuation of the secular bull market into uncharted territory.
- Support levels: On the downside, immediate structural support is identified at the 50,500 level. A failure to maintain this floor would bring the key 48,500 support zone into focus, which aligns with the lower boundary of the ascending trendline within the bullish channel pattern and the 200-day SMA. A breach of this 48,500 pivot would significantly increase the probability of a deeper structural correction.
- Momentum indicators: Both the Moving Average Convergence Divergence (MACD) and the Relative Strength Index (RSI) are currently in overbought territory. These elevated readings suggest that immediate upward momentum may be becoming exhausted, increasing the likelihood of a short-term technical retracement or a temporary consolidation phase.
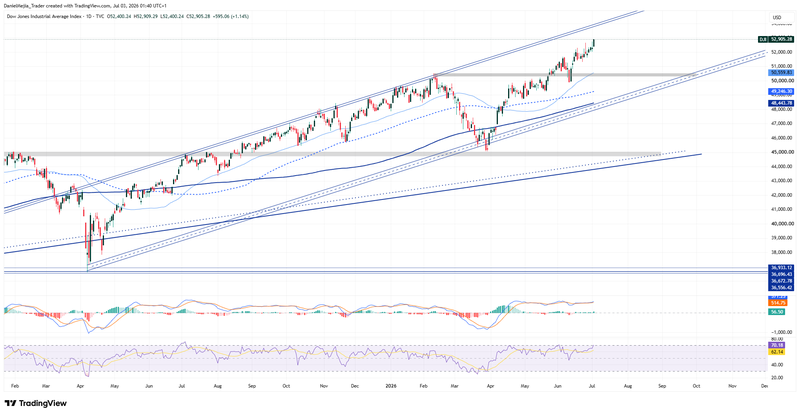
Figure 2. Dow Jones Index (2025–2026). Source: Own analysis conducted via TradingView.


