Support
European natural gas extends rally, reaching its highest price since December 2022
European natural gas futures have surged by 242% year-to-date to reach €97 per megawatt-hour, hitting a multi-year high. Supply disruptions stemming from Middle Eastern and East European conflicts, coupled with reduced storage reserves, are stoking acute fears of a winter deficit.

European natural gas futures (TTF) reached €97, registering a 242% YTD gain driven by mounting supply concerns.
Heightened conflict in the Middle East has restricted Qatari LNG shipments and impaired navigation through the Strait of Hormuz.
Ongoing geopolitical tensions between Russia and Ukraine continue to weigh heavily on European energy security.
EU gas storage facilities, standing at 74.6% capacity, trail prior-year levels by 11 percentage points, heightening winter shortage risks.
Date: 28 October 2026 (GMT+3)
Why are European natural gas prices increasing?
The Title Transfer Facility (TTF) natural gas futures contract—the primary benchmark for European gas pricing—has reached the €97 mark for the first time since December 2022. On a year-to-date (YTD) basis, the price has accumulated a 242% appreciation, reflecting strong bullish momentum.
Against this backdrop, the advance in TTF futures has been driven predominantly by concerns regarding natural gas supply ahead of the winter season. During this period, heating requirements across Europe tend to drive a sharp seasonal increase in demand.
However, Europe faces ongoing supply disruptions amidst the conflict involving the US and Iran, which has curtailed liquefied natural gas (LNG) exports from Qatar and hindered shipping flows through the Strait of Hormuz. Concurrently, the Russia-Ukraine war continues to shape Europe's broader energy security outlook. These combined geopolitical tensions have tightened global LNG availability, intensifying competition between European and Asian buyers for alternative cargoes.
Furthermore, European Union natural gas storage facilities were approximately 74.6% full as of late October, representing an 11-percentage-point deficit compared to the same period last year—as cited by Reuters. With inventories below year-earlier levels and supply remaining constrained, market participants are increasingly concerned that colder weather or further disruptions could accelerate drawdown rates and severely tighten Europe's gas balance over the winter.
Technical analysis of the natural gas futures contract
From a technical perspective, the TTF Natural Gas futures contract is exhibiting strong underlying bullish momentum. A detailed examination of the market structure reveals several key observations:
- Trend Context: Over recent months, the Natural Gas contract has established a clear bullish structure, characterised by higher highs and higher lows. Furthermore, the price is trading above its 50-day, 100-day, and 200-day Simple Moving Averages (SMAs), confirming that the primary bullish bias remains firmly intact.
- Momentum Indicators: The Moving Average Convergence Divergence (MACD) indicator maintains an upward trajectory, signalling that short-term bullish momentum could persist. Nevertheless, the Relative Strength Index (RSI) is trading in overbought territory, suggesting that a temporary price retracement or consolidation phase could occur.
- Resistance Levels: Should upward momentum persist, the next major technical ceiling lies at the €100 threshold—a significant psychological barrier. Beyond this level, a secondary technical ceiling is identified at the €110 mark.
- Support Levels: In the event of a price retracement, initial downside support is anchored around the €83 zone—a level that converges with the Volume Profile's Value Area High (VAH). Should this level be breached to the downside, key secondary support lies at €72, converging with the Volume Profile's Point of Control (POC).
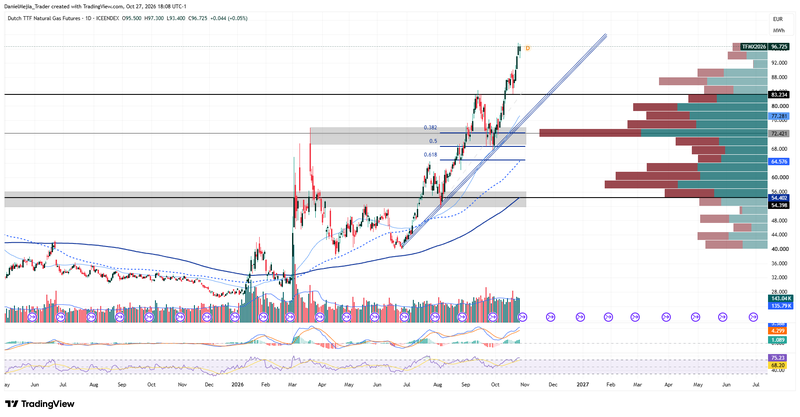
Figure 1: TTF Natural Gas Futures Contract (2025–2026). Source: Data from ICE-ENDEX Exchange; author's analysis conducted via TradingView.