
 Support
 GBP/USD retreats amid rising Fed tightening expectations and stable UK jobs data
The GBP/USD pair dropped to $1.3370 as hawkish Federal Reserve rate-hike expectations outweighed strong UK employment data.
UK job gains beat forecasts at 148K, keeping the unemployment rate steady at 4.9% and reducing immediate pressure on the Bank of England (BoE).
Rising oil prices boosted the odds of a September Fed rate hike to 55.7%.
The pair fell 0.38% as hawkish Fed policy expectations offset the resilience of the UK labour market.
GBP/USD declines as hawkish Fed expectations outweigh steady UK labour market
According to data from the United Kingdom’s Office for National Statistics (ONS), the unemployment rate remained steady at 4.9% in May, defying market consensus forecasts of an increase to 5.0%. Concurrently, UK employment change exhibited a solid rise from 99K in April to 148K in May, comfortably exceeding the consensus forecast of 85K.
This convergence highlights intrinsic strength within the labour market, easing pressure on the Bank of England (BoE) to adopt a dovish stance. However, although the annual inflation rate held steady at 2.8% in May, it remains above the central bank’s 2.0% target. In this context, market expectations do not yet reflect a clear trajectory for the BoE's monetary policy.
Conversely, the Federal Reserve is facing mounting pressure to implement a more restrictive monetary policy amid a current headline inflation rate of 3.5%. Meanwhile, crude oil prices continue to advance: the Brent futures contract (BRNU6) rose by 2.01% to $91.01 per barrel, while the West Texas Intermediate (WTI) futures contract (CLU6) appreciated by 2.24% to $84.66 per barrel. Consequently, according to the CME FedWatch Tool, the implied probability of a 25-basis-point interest rate hike at the September meeting advanced to 55.7%, becoming the most probable outcome.
This divergence in the monetary policy environment has exerted downward pressure on the British pound against the US dollar in recent sessions. At the market close, the GBP/USD pair depreciated by 0.38% to settle at $1.3370.
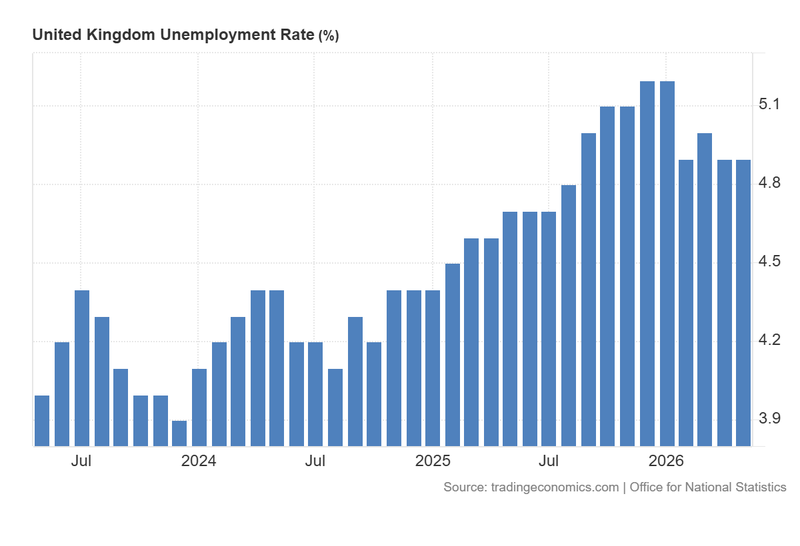
Figure 1. United Kingdom Unemployment Rate (2023–2026). Source: Data from the UK Office for National Statistics; figure obtained from Trading Economics.
Technical analysis of the GBP/USD pair
From a technical perspective, the GBP/USD pair continues to trade within the parameters of a well-defined long-term bullish channel. However, the immediate market structure suggests a transition into a consolidative or corrective phase:
- Trend Context: While the pair maintains a long-term bullish trajectory defined by a sequence of higher highs and higher lows, it is currently testing its 50-day, 100-day, and 200-day Simple Moving Averages (SMAs) to the downside, suggesting that selling pressure is becoming a more prominent factor in the prevailing trend.
- Resistance Levels: Should the short-term resistance zone near $1.3500 be cleared to the upside, the next critical resistance level is $1.3650, a long-term structural ceiling. A decisive daily close above this threshold would signal a formal resumption of the primary bullish trend and a potential extension into higher price territory.
- Support Levels: If short-term bearish momentum persists, the next critical floor is identified at $1.3180. This level represents a key convergence zone between short-term structural support and the lower boundary of the broader bullish channel. A breach of the $1.3180 zone would significantly increase the probability of a deeper market correction.
- Momentum Indicators: Both the Moving Average Convergence Divergence (MACD) and the Relative Strength Index (RSI) are exhibiting neutral performance, reflecting a lack of a predominant market trend. Notably, although the MACD line recently crossed above the zero line, it is now signalling a downward inflection point, indicating that the bullish crossover lacked conviction.
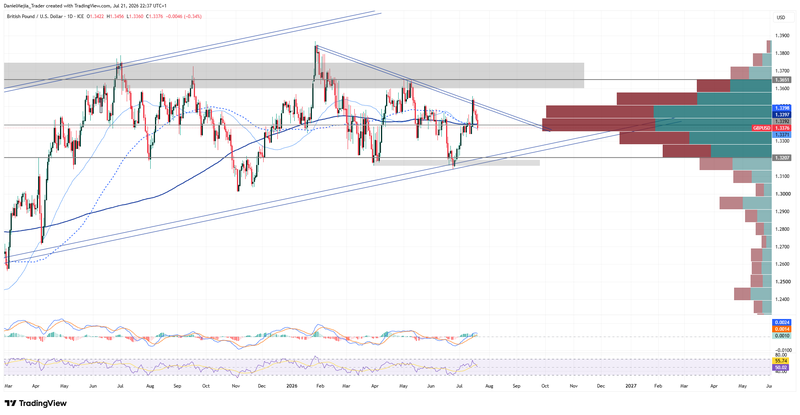
Figure 2. GBP/USD pair (2025–2026). Source: Data from the Intercontinental Exchange (ICE); own analysis conducted via TradingView.


