Gold breaks below key technical level as hawkish Fed expectations rise
Gold fell below a key technical support level as rising expectations of a more hawkish Federal Reserve outweighed safe-haven demand arising from tensions in the Middle East. Higher implied odds of further rate increases added pressure to bullion, which closed at $4,282.

Gold fell by 1.89% to $4,282 as hawkish Federal Reserve expectations intensified selling pressure.
CME FedWatch showed rising odds of tighter monetary policy, including a 35% probability of a 25-basis-point rate increase in September.
Middle East tensions remained elevated, with continued Israeli-Iranian attacks and Trump’s warning increasing the risk of a broader conflict.
Gold slides under key support amid rising hawkish Fed bets
The gold futures contract (GCQ6) is breaking below a key support area as rising geopolitical tensions increase expectations that the Federal Reserve could adopt a more restrictive stance in upcoming monetary policy meetings.
On the one hand, geopolitical tensions continue in the Middle East. Although Israel and Iran have discussed the possibility of a ceasefire, bilateral attacks have persisted, raising concerns that the conflict could escalate into a broader regional dispute. In addition, US President Donald Trump wrote in a social media post that Iran had attacked the US Apache helicopter patrolling the Strait of Hormuz and threatened to respond, increasing uncertainty over whether US forces may return to direct hostilities.
On the other hand, CME’s FedWatch Tool reflects rising probabilities that the Federal Reserve may maintain a hawkish higher-for-longer stance, while also indicating increasing expectations of interest rate hikes. The implied probability of a 25-basis-point interest rate increase at the September meeting stands at 35%. Meanwhile, the FedWatch Tool shows an implied probability of 37% for a target rate of 4% at the October meeting and 47% for the December meeting, the latter being the highest reading.
At market close, the gold contract fell by 1.89% to $4,282, although at the time of writing it had recorded a further decline of 1.85%, trading near the $4,200 level. Bullion tends to weaken in a high interest rate environment, as the opportunity cost of holding non-yielding assets increases.
Technical analysis of Gold
From a technical perspective, gold futures continue to maintain a robust long-term bullish trajectory, although current selling pressure is driving a relevant market retracement. A detailed analysis of the current market structure reveals several key observations:
- Trend context: On daily timeframes, gold exhibits a bullish market structure defined by a clear sequence of higher highs and higher lows. However, price action is now breaking below its 50-day, 100-day, and 200-day Simple Moving Averages (SMAs), suggesting that bearish pressure is becoming increasingly relevant.
- Resistance levels: Should the immediate short-term resistance at $4,440 be breached to the upside—a technical resistance level where the 200-day SMA converges—the next significant technical ceiling is identified at $4,620. A sustained close above this threshold would signal the potential for a further extension to higher valuation levels.
- Support levels: In the event of a deeper price contraction, the immediate short-term support is located at the $4,120 level. If this zone is invalidated, the next critical structural floor lies at $3,950. A structural break below $3,950 would notably increase the probability of a broader correction.
- Momentum and volume: Both the Moving Average Convergence Divergence (MACD) and the Relative Strength Index (RSI) are currently exhibiting downward trajectories, suggesting that bearish momentum could continue in the short term. Nevertheless, the RSI is approaching oversold territory, indicating caution with regard to the bearish outlook.
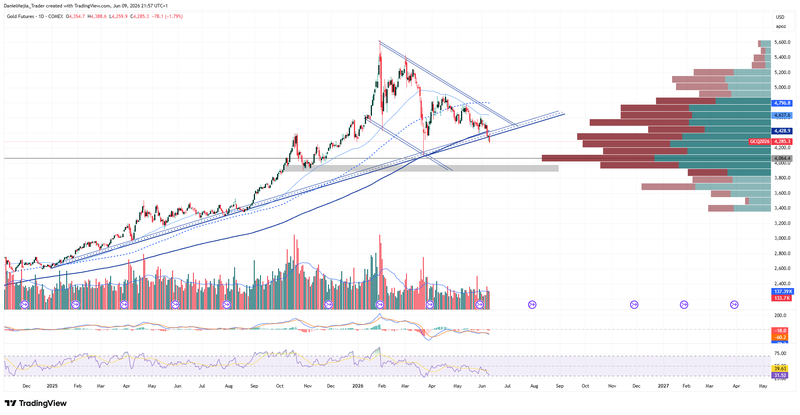
Figure 1. Gold Futures Contract (2025–2026). Source: Data from the COMEX Exchange; own analysis conducted via TradingView.


