
 Support
 Gold maintains its long-term bullish structure despite US dollar strength
Gold continues to sustain its long-term bullish trend, recording a 17.73% year-on-year (YoY) gain. Robust central bank demand and safe-haven buying continue to offset short-term headwinds stemming from a strengthening US dollar and elevated Treasury yields.
Gold futures dropped by 0.93% to $4,383 per ounce, but remains a 17.73% YoY appreciation despite a 2.80% YoY increase in the US Dollar Index (DXY).
Sustained demand from central banks and institutional investors reinforces gold's essential role as a primary safe-haven asset.
The long-term bullish structure remains intact above key Simple Moving Averages (SMAs), notwithstanding short-term selling pressure.
Date: 22 September 2026
Can Gold sustain its long-term bullish structure despite a strong US dollar?
Gold futures contracts (GCZ6) depreciated by 0.93% to $4,383 per ounce amidst a heightened likelihood that the Federal Reserve (Fed) will reinforce its restrictive monetary policy stance. According to the CME FedWatch Tool, market-implied probabilities signal a 55% chance that the US central bank will raise its benchmark interest rate by 25 basis points at its October meeting. This follows the interest rate increase implemented during the September meeting, which brought the policy rate to 4.0%.
Against this backdrop, the US Dollar Index (DXY)—which measures the greenback against a basket of major currencies including the euro, British pound, and Japanese yen—has appreciated by 1.70% over the past fortnight. A strengthening US dollar typically exerts downward pressure on bullion, rendering it more expensive for international investors.
Furthermore, an environment characterised by higher US Treasury yields generally impacts gold prices adversely, as market participants reallocate capital towards government bonds that offer higher guaranteed returns with minimal risk.
Nevertheless, despite a strong US dollar and higher policy rates, bullion retains its long-term bullish technical structure, defined by a sequence of higher highs and higher lows. Over the past three months, gold has accumulated gains of approximately 5%, whilst recording a year-on-year (YoY) appreciation of 17.73%—even as the DXY registered a 2.80% YoY increase over the same period.
This trend highlights the underlying strength of gold as a predominant safe-haven asset, underpinned by robust demand from central banks and institutional investors. Moreover, it demonstrates that the conventional inverse correlation between gold and the US dollar is not deterministic; both assets can display aligned market trajectories within the same timeframe.
Technical analysis of Gold
From a technical perspective, gold futures continue to follow a robust long-term bullish trajectory. A detailed analysis of the current market structure reveals several key observations:
- Trend context: On daily timeframes, gold exhibits a bullish market structure defined by a pattern of higher highs and higher lows. Crucially, prices remain above both the 50-day and 100-day Simple Moving Averages (SMAs), reinforcing the prevailing upward bias. Although short-term selling pressure is evident, the broader structural trend remains firmly intact.
- Resistance levels: Should price action break above the 200-day SMA at $4,555, the next major technical ceiling is identified at $4,775—a level where short-term technical resistance converges with the Volume Profile’s Value Area High (VAH). A sustained close above this threshold would signal the potential for further upside expansion.
- Support levels: In the event of a pull-back, immediate short-term support lies at $4,270, coinciding with a short-term 61.8% Fibonacci retracement level. If this zone fails to hold, the next critical structural floor resides at the $4,000 psychological milestone. A decisive breach below these zones would notably increase the probability of a broader market correction.
- Momentum and volume: Both the Moving Average Convergence Divergence (MACD) and the Relative Strength Index (RSI) are trending downwards, suggesting that short-term bearish pressure may persist. Nevertheless, fundamental drivers are expected to remain the primary determinants of future price direction.
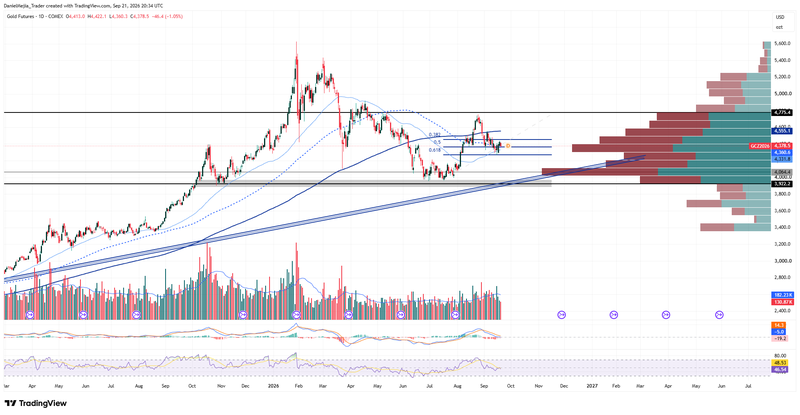
Figure 1. Gold Futures Contract (2025–2026). Source: Data from COMEX Exchange; author's analysis conducted via TradingView.


