
 Support
Silver under pressure as treasury yields rise: can 60.95 hold?
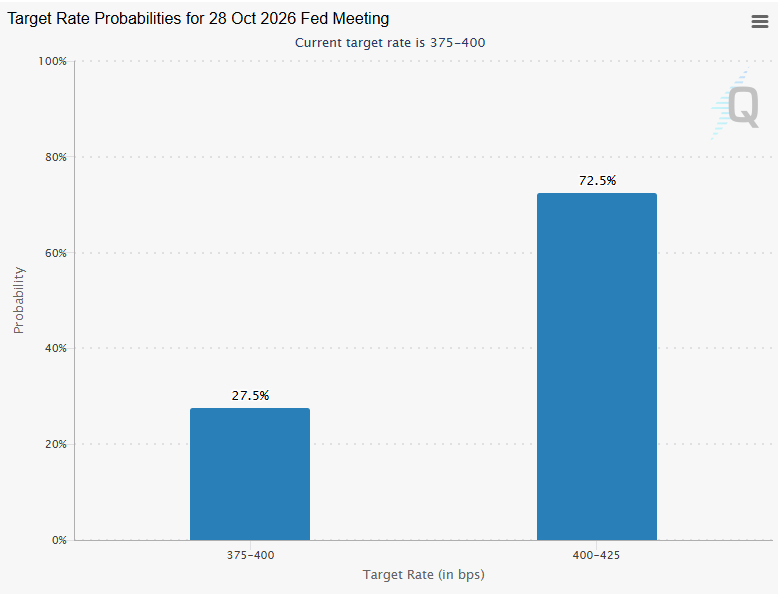
US Treasury yields climb above 5.2% and traders’ price roughly a 70% probability of another Federal Reserve rate hike in October. That is weighing on silver investment flows, with silver ETFs showing renewed outflows. At the same time, China is tightening the framework governing silver exports, creating a potential constraint on physical supply.

The 10-year Treasury yield recently reached 5.238%.
Chinese silver exports reached roughly 5,100 tonnes.
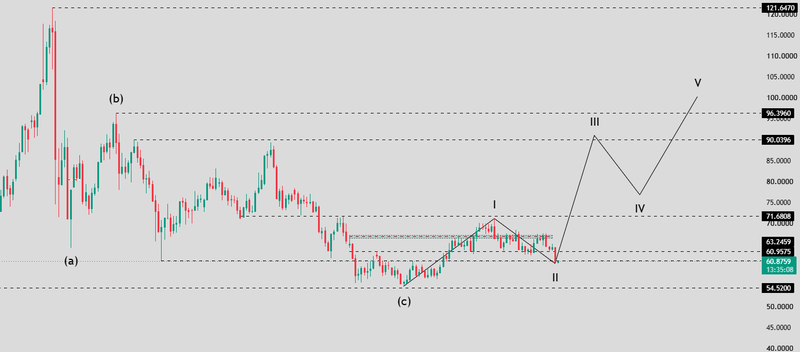
If buyers defend 60.95, the current decline can still fit comfortably within a Wave II retracement.
Higher yields are draining momentum from silver ETFs
The immediate pressure is monetary policy. The 10-year Treasury yield recently reached 5.238%, its highest level since June 2007, while markets moved above 72% probability of an October Fed hike. Higher yields raise the opportunity cost of holding an asset that generates no interest income.
That has already shown up in ETF positioning. Recent data show continued selling from major silver funds, including substantial weekly outflows from the large silver-mining ETF SIL.
The important point is that ETF selling does not necessarily mean silver's physical fundamentals have deteriorated. It means the investor willing to hold silver against a 5% Treasury yield is becoming harder to find. China is tightening access without imposing an outright export ban.
Source: CME Group
China's role introduces a very different variable
Beijing has maintained a state-trading and licensing regime for silver exports for years, and its rules for 2026–2027 continue to restrict eligible exporters. The new framework ultimately approved 44 silver-exporting companies, two more than previously, rather than introducing a blanket export ban.
That distinction matters
The policy gives Beijing greater control over who can export and creates the possibility of tighter shipments if authorities decide domestic supply should take priority.
But China has not demonstrated an intention to stop exports altogether. In 2025, Chinese silver exports reached roughly 5,100 tonnes, the highest level in at least 16 years.
The market is therefore dealing with policy-controlled supply, not necessarily disappearing supply.
Why China matters more now
China is both a major silver consumer and an important part of the global refining and trading system. Chinese silver imports also surged to a record in March, reaching about 836 tonnes, driven by demand from investors and the country's enormous solar industry.
That creates a structural tension
The more metal China absorbs domestically, the less is available for international markets. At the same time, silver supply cannot respond quickly. Much of global mine production comes as a by-product of copper, lead, zinc and gold mining, limiting how rapidly higher silver prices can create additional primary supply.
The Silver Institute expects the global market to remain in deficit for a sixth consecutive year in 2026, at about 46.3 million ounces. The physical market is becoming more important than the ETF market This is where the current sell-off becomes interesting. ETF investors can exit within hours.
Mine supply cannot
The Silver Institute expects global stocks to remain under pressure after years of structural deficits, while tight physical liquidity has already contributed to higher lease rates and episodes of market stress.
That means silver can experience weaker investment flows without immediately losing its physical scarcity premium.
The risk for bulls is that persistent high yields eventually weaken industrial and investment demand faster than supply tightness can offset it. The risk for bears is the opposite: ETF selling reduces the paper price just as physical availability becomes increasingly constrained.
Technical Outlook
The pullback from 71.68 has remained relatively contained and is now testing the 60.95–63.25 support zone. That makes this area critical for the broader structure: the market is effectively deciding whether the decline is a normal Wave II correction or evidence that the move from 54.52 was only a corrective rebound.
60.95–63.25 is the key support zone
If buyers defend 60.95–63.25, the current decline can still fit comfortably within a Wave II retracement.
Importantly, Wave II does not necessarily need to return to 54.52. A shallower correction would still be consistent with the proposed bullish count, particularly if silver begins establishing higher lows inside or above the current support zone.
The next important signal would come from price structure rather than the support test itself. A clear recovery accompanied by successive higher lows would suggest that selling pressure is fading and that buyers are preparing to challenge the previous Wave I high.
Scenarios ahead
If silver holds 60.95–63.25 and begins forming higher lows, a break above 71.68 would strengthen the bullish count and open the way towards 90.04, followed by a potential Wave V move towards 96.39 after an intervening correction.
A decisive break below 60.95 would increase the risk of a deeper decline towards 54.52. A sustained break below 54.52 would invalidate the proposed bullish cycle and suggest that the rally from that level was corrective rather than the start of a new impulse.
For now, 60.95–63.25 is the key support zone, while 71.68 remains the main confirmation level.
Source: Trading view


