S&P rises significantly nearing 4,1790 points
Despite improvements in the US labor market, inflation remains above targeted levels

The number of initial jobless claims in the US increased to 264,000 last week
There is a positive technical pattern for the index with the surpassing of 4,170 points
The index has been trading in a sideways movement for the past six weeks.
Economic events affecting movements in the SPX500 index
On Thursday, the US stock indices experienced significant declines due to the uncertainty surrounding the ongoing US debt ceiling crisis. As negotiations between President Biden and McCarthy remained stalled, there were concerns that the US could default on its debt. In this context, Janet Yellen, the US Treasury Secretary, issued a warning about the potential risks of a US default. Yellen emphasized that such a scenario could have severe consequences and would pose a threat to the ongoing economic recovery of the United States.
Data released by the US Department of Labor showed that the number of initial jobless claims in the US increased to 264,000 last week, compared to the previous reading of 242,000.
As for trading, the S&P500 index witnessed a limited decline during yesterday's trading, as the index closed Thursday's session near the 4,133 level.
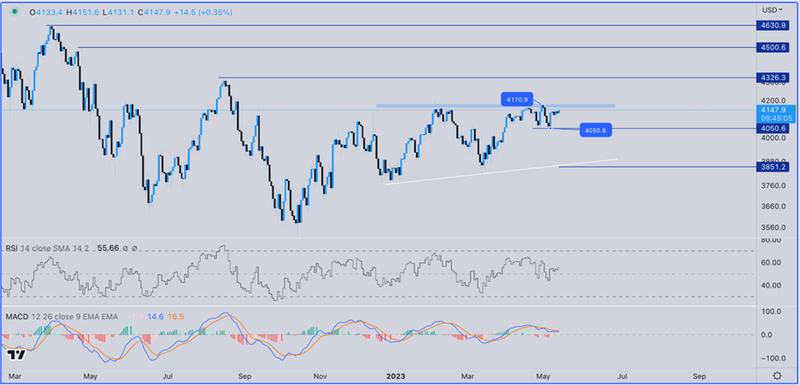
Key technical and pivotal levels affecting movements in the S&P500 index
The S&P index managed to rise to test the 4,170 resistance level couldn’t break above, and it is still moving near this level in a sideways movement between the 4,170 resistance level and the 4,050 support level.
If the index manages to surpass the 4,170 resistance level, which represents the upper limit of an ascending triangle pattern formed on the daily timeframe, this may contribute to an extension of the upward trend to test the 4,325 level, and then surpassing it may extend the upward trend to the 4,500 level. However, all of this is contingent on prices remaining above the 4,170 resistance level.
If the index fails to surpass the 4,170 resistance level, it is likely to decline to test the 4,050 support level. If this level is broken, the downward trend may extend to test the 3,850 support level, which represents the lower limit of the ascending triangle pattern formed on the index.