Support
Treasury yields reclaim 5% threshold as inflation pressures mount
Rising inflation drove 10-year US Treasury yields back to 5% as higher consumer prices intensified expectations of a Federal Reserve interest rate hike at its upcoming December meeting.

October US inflation figures exceeded forecasts, driven by food and housing costs.
10-year Treasury yields jumped 11.6 basis points to return to the 5% level.
The CME FedWatch probability of a December Fed rate increase soared to 90%.
Expectations of tighter monetary policy triggered Treasury sell-offs, pushing yields higher.
Date: 11 November 2026 (GMT+3)
Are rising inflation pressures driving Treasury yields back to 5%?
Benchmark 10-year US Treasury yields rose by 11.6 basis points, returning to the 5% threshold, as the inflation rate accelerated above analysts' expectations, reinforcing the likelihood of an interest rate hike by the Federal Reserve at its December meeting. Notably, 2-year Treasury yields—the benchmark most sensitive to Fed monetary policy shifts—jumped by 18 basis points to 4.75% amid hawkish expectations.
The US Bureau of Labour Statistics (BLS) reported that headline inflation rose by 0.4% month-on-month (MoM) in October, exceeding analysts' forecasts of 0.3%. Additionally, the BLS reported that the core inflation rate—which excludes volatile energy and unprocessed food components—advanced by 0.3%, surpassing market consensus estimates of 0.2%.
The BLS report exhibited that the most significant price increases occurred in food and housing—as highlighted by CNBC. This is particularly relevant for the Federal Reserve, as persistent price pressures across essential consumer categories could complicate its efforts to bring inflation under control.
Consequently, the CME FedWatch Tool indicated a 90% market-implied probability that the US central bank will raise its benchmark interest rate by 25 basis points at its upcoming meeting, followed by a 9.5% likelihood of a 50-basis-point increase. This contrasts sharply with previous readings, which indicated a 72% probability of a 25-basis-point hike and zero probability of a 50-basis-point move.
US Treasury yields tend to rise amid growing expectations of a more restrictive monetary policy stance from the Federal Reserve, as investors adjust their bond holdings in anticipation of higher interest rates and potentially more attractive yields on newly issued debt. This shift can trigger selling pressure across the Treasury market, pushing bond prices lower. Because bond prices and yields move inversely, sell-off drives yields upward, reflecting market repricing of interest rate expectations and broader financial conditions.
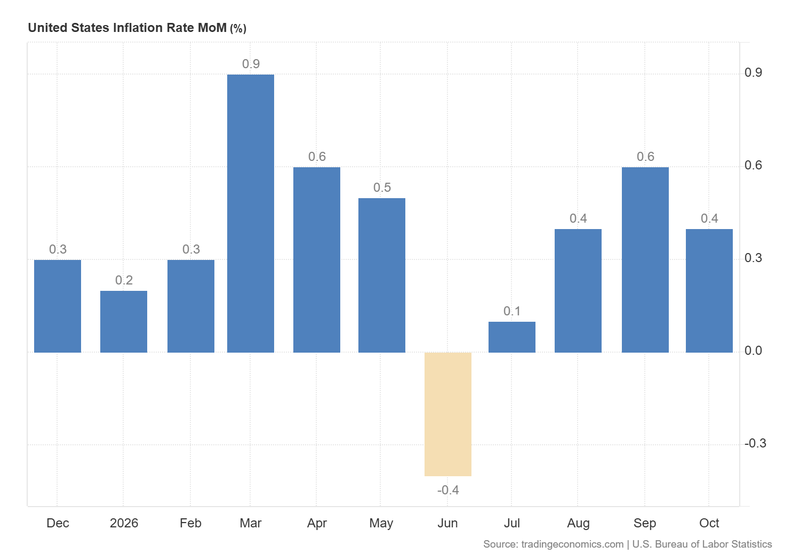
Figure 1. US Inflation Rate MoM (2025–2026). Source: Data from the US Bureau of Labour Statistics; chart retrieved via Trading Economics.
Technical perspective on US Treasury yields (10-year)
From a technical standpoint, US Treasury yields exhibit an upward trajectory. Key technical observations include:
- Trend Context: On the daily timeframe, yields display bullish momentum, trading comfortably above their 100-day and 200-day Simple Moving Averages (SMAs). Notably, yields have rebounded off the 100-day SMA and a structural support zone, reinforcing the bullish bias.
- Momentum Indicators: Both the Moving Average Convergence Divergence (MACD) and the Relative Strength Index (RSI) are sloping upwards from multi-month lows, suggesting that an upward impulse could strengthen in the short term. Additionally, the MACD line exhibits a potential inflection point, while the negative histogram continues to contract.
- Resistance Levels: Should upward momentum persist, the next key resistance level is 5.30% (the previous peak), followed by a secondary technical ceiling at 5.50%—a key psychological threshold.
- Support Levels: Should bearish momentum re-emerge, the primary technical floor is short-term support at 4.81% (the 100-day SMA zone), followed by the 4.56% level—a market zone where the 200-day SMA stands.
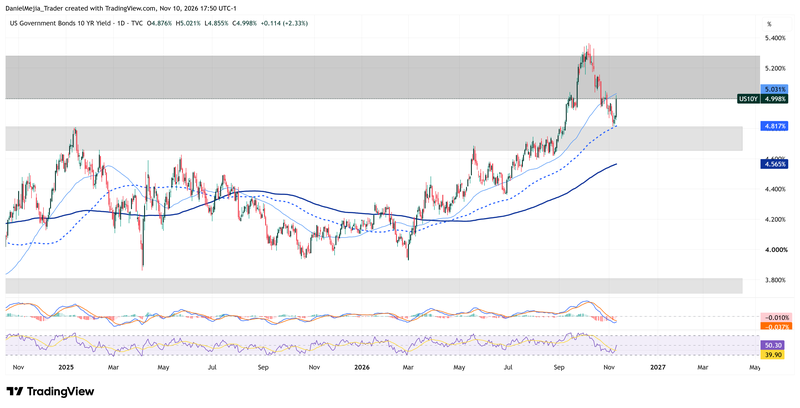
Figure 2. US Treasury Yields (2025–2026). Source: Author's analysis via TradingView.