UK GDP expands by 0.6% in final revision; GBP/USD maintains upward trend
UK GDP expanded by 0.6% in the final first-quarter revision, matching expectations and marking the strongest quarterly growth since Q1 2025. Services, production, and construction supported the economy’s resilience.

UK Q1 GDP was confirmed at 0.6%, matching expectations and marking the strongest quarterly growth since Q1 2025.
Year-on-year GDP rose by 0.9%, supported by services output, production, and construction.
Economic resilience may keep the Bank of England focused on price pressures amid softer unemployment.
Final UK GDP revision points to 0.6% growth
According to data from the United Kingdom’s Office for National Statistics, gross domestic product (GDP) remained unchanged in its final revision for the first quarter of 2026 at the 0.6% level, in line with analysts’ expectations. The current reading represents the strongest level since Q1 2025, when UK GDP reached the same pace of growth. Consequently, the year-on-year (YoY) GDP growth rate advanced by 0.9%, reflecting economic resilience despite ongoing global inflationary pressures resulting from the conflict in the Middle East.
An analysis by Trading Economics indicates that GDP growth in the United Kingdom was driven by services output, which advanced by 0.8% in Q1, as well as production output, which rose by 0.2%, and construction, which increased by 0.2%. Therefore, it is possible that the Bank of England will remain focused on inflationary pressures, as the broader economy continues to show resilience while the unemployment rate declined in its latest reading, reaching 4.9% in April. The BoE is still facing an inflation rate that has remained at 2.8% for two consecutive months, although this remains above the central bank’s 2% target.
Following the economic release, the British pound appreciated marginally by 0.02% against the US dollar to $1.3257, while the GBP/USD pair continues to maintain a bullish structure in its price action.
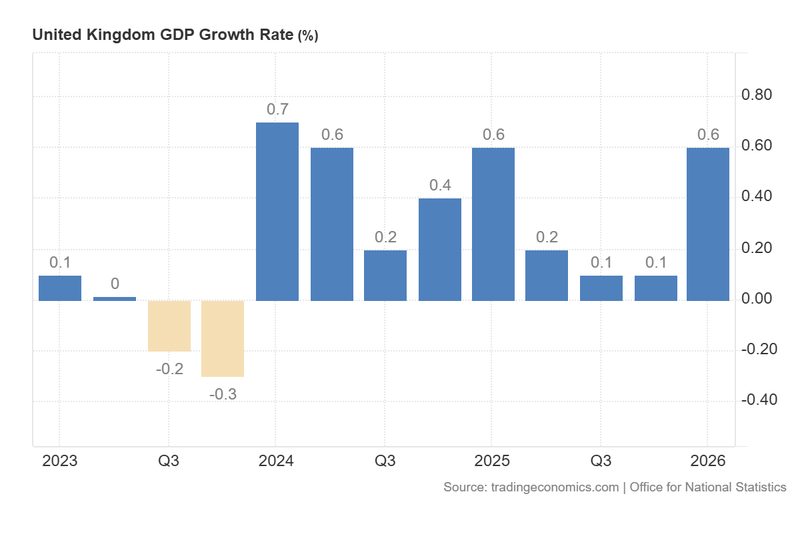
Figure 1. United Kingdom Inflation Rate (2025–2026). Source: Data from the UK Office for National Statistics; figure obtained from Trading Economics.
Technical analysis of the GBP/USD pair
From a technical perspective, the GBP/USD pair continues to trade within the parameters of a well-defined long-term bullish channel. However, the immediate market structure suggests a transition into a consolidative or corrective phase:
- Trend context: While the pair maintains a long-term bullish trajectory defined by a sequence of higher highs and higher lows, although it is currently trading below its 50-day, 100-day, and 200-day Simple Moving Averages (SMAs), suggesting that selling pressure is becoming a more significant factor in the market trend.
- Resistance levels: Should the support zone close to $1.3200 be respected and rejected to the upside, the next critical resistance level is $1.3400, a zone where the 200-day SMA converges. A decisive daily close above this threshold would signal a formal resumption of the primary bullish trend and a potential extension into higher price territory, notably the $1.3650 level.
- Support levels: If short-term bearish momentum persists, the next critical floor is identified at $1.3170. This level represents a key convergence zone between short-term structural support and the upper boundary of the broader bullish chart pattern. A breach of the $1.3170 zone would significantly increase the probability of a deeper market correction, notably towards the $1.3000 level.
- Momentum indicators: Both the Moving Average Convergence Divergence (MACD) and the Relative Strength Index (RSI) are exhibiting downward trajectories, suggesting that selling pressure could continue. Nevertheless, the RSI is approaching oversold territory, which could imply a short-term consolidation phase until the market establishes a clearer directional bias.
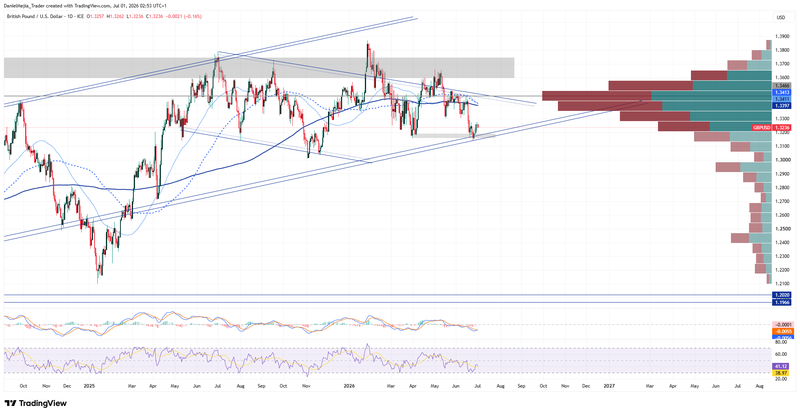
Figure 2. GBP/USD pair (2025–2026). Source: Data from the Intercontinental Exchange (ICE); own analysis conducted via TradingView.


