Support
 US-Canada bilateral tariffs weigh on the Canadian dollar
The Canadian dollar depreciated by 0.57% against the US dollar following bilateral US-Canada tariff threats.
The Canadian dollar fell to 1.3842 after the US announced 50% automotive tariffs and Canada vowed retaliation.
Tariff measures have disrupted short-term market momentum without revoking fundamental USMCA trade terms, although risks remain elevated.
High bilateral economic integration creates systemic risks, rendering widespread supply chain disruptions difficult.
Date: 24 August 2026
Bilateral US-Canada tariffs cloud the outlook for the Canadian dollar
The Canadian dollar depreciated by 0.57% against the US dollar following bilateral tariff threats between the United States and Canada, with the USD/CAD pair closing at 1.3842.
According to a CNBC report, US President Donald Trump announced that Washington would raise tariffs on imports of cars, trucks, and automotive parts from Canada to 50%, effective 1 January 2027. This announcement followed the US decision on Saturday to impose 50% tariffs on approximately $20 billion worth of Canadian goods after bilateral trade negotiations broke down. In response, Canadian Prime Minister Mark Carney stated that Ottawa would impose retaliatory tariffs on US goods on a ‘dollar-for-dollar’ basis, as reported by Reuters.
However, while these actions could be interpreted as a renewed trade war between the US and Canada, they do not signify the termination of USMCA treatment. The tariff announcements do not eliminate preferential tariff treatment for products covered under the trade agreement, although risks remain elevated. Given the high degree of integration between the two economies, disrupting broader supply chains would be difficult, as doing so could trigger systemic risks and adversely affect both nations.
For the USD/CAD pair, the Canadian dollar's recent period of appreciation has paused, while short-term momentum oscillators indicate a potential inflection point or consolidation phase within the current price action structure.
Technical analysis of the USD/CAD pair
From a technical perspective, the USD/CAD pair has exhibited short-term bearish performance in recent weeks. Key structural observations include:
- Trend Context: Although the USD/CAD pair has followed a downward trajectory over recent weeks, the price is currently recovering its 200-day simple moving average (SMA), thereby maintaining an underlying bullish bias.
- Resistance Levels: Should price action surpass the 1.3850 level—a zone where the 200-day SMA and the 61.8% Fibonacci retracement level converge—the next major technical ceiling is identified at 1.3950. A decisive breakout above this zone would signal the potential for an extended rally into higher price territories, notably towards the 1.4120 level.
- Support Levels: If the 1.3850 level is invalidated to the downside, the next relevant support floors rest at 1.3745 and 1.3560. A structural break below these support levels would significantly increase the probability of a deeper market correction.
- Momentum Indicators: Both the Moving Average Convergence Divergence (MACD) and the Relative Strength Index (RSI) are currently trading deep within oversold territory, signalling a potential market reversal or consolidation phase. However, fundamental drivers are expected to dictate the market's future trajectory.
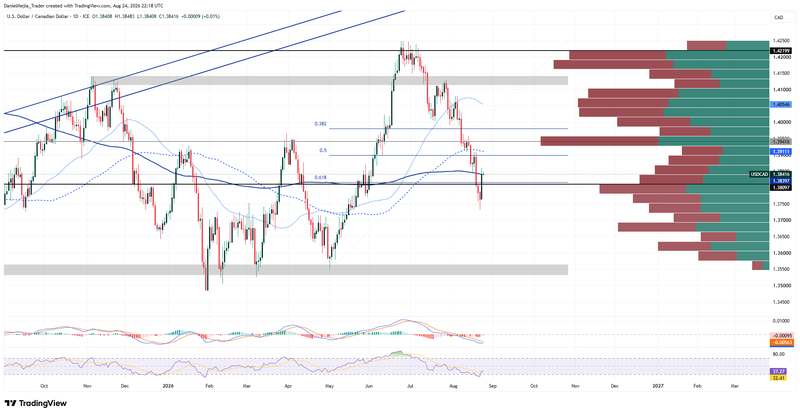
Figure 1. USD/CAD Pair (2025–2026). Source: Data from the Intercontinental Exchange (ICE); author's analysis conducted via TradingView.