
 Support
 US dollar index falls amid growing concerns over US debt
The US Dollar Index fell sharply as national debt surpassed $40 trillion. Growing deficit, record interest servicing costs, and technical selling pressure weighed heavily on investor confidence.

US national debt crossed $40 trillion, accompanied by expanding deficit and quarterly interest payments reaching $1.25 trillion.
Thirty-year Treasury yields spiked to 5.31%, dampening expectations of near-term interest rate hikes by the Federal Reserve.
The US Dollar Index dropped by 0.88% to 98.78, driven by diminishing investor confidence amid elevated debt risks.
Date: 19 August 2026
Dollar index slips as US debt worries intensify
According to reports from Reuters and CNBC, the US Department of the Treasury revealed that government debt has topped the $40 trillion threshold for the first time. This development is significant, as essential public spending—including already constrained social safety programmes—could be severely impacted if interest servicing costs continue to escalate.
Additionally, the US federal deficit has expanded in recent months due to tariff refunds. This surge occurs as total debt has nearly doubled in less than a decade, spanning the administrations of Donald Trump and Joe Biden. Consequently, this heightens risks for US citizens, as potential fiscal remediations—namely reduced public expenditure or tax increases—are deeply unpopular at a time when inflation remains elevated and employment growth is decelerating.
Concurrently, the yield on US 30-year government bonds reached its highest level since May 2007 at the beginning of the week, touching 5.31%. By market close, the benchmark yield retreated to 5.19% as the probability of near-term Federal Reserve interest rate hikes waned in light of escalating fiscal risk. Data from the CME FedWatch Tool indicated that market-implied probabilities of an interest rate increase this year have been delayed until the December meeting, registering a 47% likelihood.
An environment characterised by high public debt and elevated benchmark interest rates typically undermines investor confidence, as government expenditure becomes increasingly vulnerable to spiralling debt servicing costs. The latest monthly report from the US Treasury signalled a $432.3 billion deficit for July, the highest since March 2021—as cited by CNBC. Furthermore, data from the Federal Reserve Bank of St. Louis reveals that federal government interest payments reached $1.25 trillion in Q2 2026, marking their highest level since 1950.
Consequently, this underscores a dilemma for the Federal Reserve: while the central bank continues to combat persistent inflation, further interest rate increases risk worsening the fiscal debt burden. By the market close, the US Dollar Index had fallen sharply by 0.88% to 98.78 points, reflecting diminished confidence among market participants.
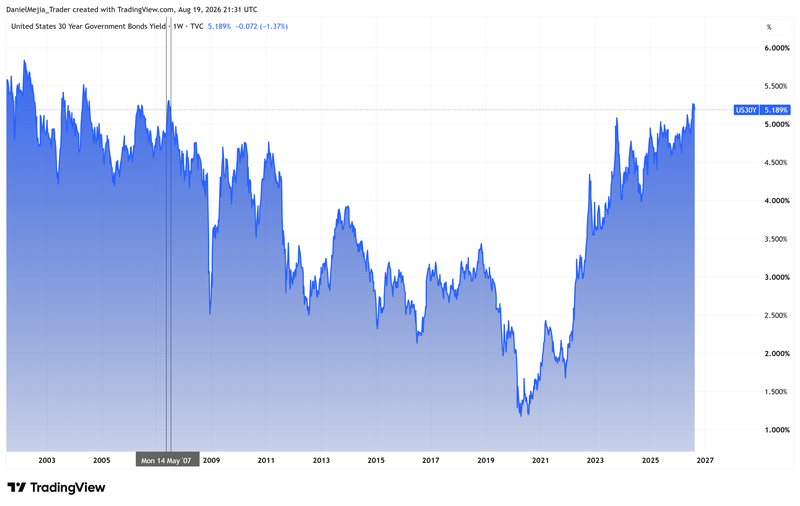
Figure 1. US 30-Year Government Bond Yield (2002–2026). Source: Author’s analysis via TradingView.
Technical analysis of the Dollar Index (DXY)
From a technical perspective, the Dollar Index exhibits downward pressure across its short-term trajectory. Key observations include:
- Trend context: Over the medium term, the index remains within a range-bound pattern. However, recent selling pressure has breached the 50-day, 100-day, and 200-day Simple Moving Averages (SMAs), signalling predominantly bearish momentum.
- Resistance levels: To the upside, the 100.00 level represents a significant technical hurdle and a key psychological barrier. A decisive breakout above this threshold would shift market focus towards the 101.50 handle. A sustained move above 101.50 would signal a broader transition into a higher trading range.
- Support levels: On the downside, should current selling pressure persist, key structural support lies at 97.70. A breach of this floor would bring the next critical area of interest at 96.50 into focus, representing a prominent short-term technical support level. A breakdown below 96.50 would likely trigger a deeper bearish correction.
- Momentum indicators: Both the Moving Average Convergence Divergence (MACD) and the Relative Strength Index (RSI) are trending downwards, reflecting intensified short-term bearish pressure. However, as both indicators approach oversold territory, macroeconomic fundamentals are expected to become the primary catalysts dictating future price action.
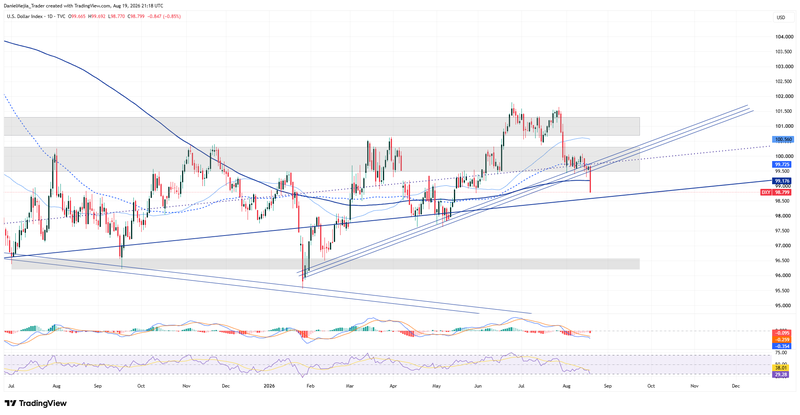
Figure 2. Dollar Index (2025–2026). Source: Intercontinental Exchange (ICE) data; author's analysis via TradingView.


