Support
 US dollar index surpasses 102.50, reaching its highest level since April 2025
The US Dollar Index (DXY) has reached a multi-month high above 102.50, driven by persistent US inflation, hawkish Federal Reserve expectations, higher Treasury yields, and widening interest rate differentials against major global central banks.

The US Dollar Index surpassed 102.50, propelled by persistent inflationary pressures and hawkish Fed rate expectations.
PCE inflation at 3.4% reinforces market expectations of a 25-basis-point Fed rate hike in December.
Higher US bond yields relative to lower policy rates across Europe and Japan continue to bolster greenback demand.
Technical indicators signal robust bullish momentum, although overbought readings suggest short-term caution.
Date: 13 October 2026
Which factors explain the bullish momentum of the US dollar index?
The US Dollar Index (DXY) recently surpassed the 102.50 mark, attaining a level not observed since April 2025. At market close, the DXY appreciated by 0.32%. This strong performance has been reinforced by rising expectations that the Federal Reserve will maintain a restrictive monetary policy stance to contain persistent price pressures.
While the CME FedWatch Tool reflects an 80% market-implied probability that the US central bank will hold its benchmark interest rate steady at 4.00% at its October meeting, it indicates a 70% likelihood of a 25-basis-point rate increase at its December meeting. Currently, the US central bank is confronting a Personal Consumption Expenditures (PCE) Price Index—the Federal Reserve's preferred inflation metric—of 3.4%, alongside a Core PCE reading of 3.0%, both of which remain well above the Fed's 2.0% target.
Conversely, while other Western central banks are experiencing inflationary pressures, their benchmark interest rates remain below the US reference rate. On the one hand, the Bank of Japan (BoJ) increased its policy rate to 1.25%, whilst the European Central Bank (ECB) similarly raised its rate to 2.65%; however, both rates stand below the current US benchmark of 4.00%. Meanwhile, the Bank of England (BoE), the Bank of Canada (BoC), the Swiss National Bank (SNB), and Sweden's Riksbank have maintained their policy rates unchanged at 3.75%, 2.25%, 0.00%, and 1.75%, respectively.
Consequently, the greenback continues to gain value as US Treasury yields become increasingly attractive to international investors due to higher relative interest rates in the United States. The DXY—which measures the US dollar against a basket of currencies comprising the euro, Japanese yen, British pound, Canadian dollar, Swiss franc, and Swedish krona—is experiencing elevated demand, primarily as global investors seek liquidity to acquire US government debt instruments.
Additionally, Cleveland Federal Reserve President Beth Hammack noted—as reported by CNBC—that tighter monetary policy may be needed to contain inflation in order to prevent an inflationary mindset from becoming entrenched in the economy. This reinforces the hawkish bias regarding the likelihood of further interest rate hikes by the Fed, driving a shift in demand towards the US dollar relative to other major currencies.
Technical perspective on the US dollar index (DXY)
From a technical standpoint, the US Dollar Index remains on an upward trajectory. Key technical observations include:
- Trend Context: Over the short term, the index is exhibiting a clear upward trend, trading comfortably above its 50-day, 100-day, and 200-day Simple Moving Averages (SMAs). Notably, the DXY recently rebounded off a long-term bullish trendline, suggesting that its upward momentum is reinforcing.
- Resistance Levels: Should the DXY maintain its bullish momentum, the 104.00 mark presents the primary technical hurdle. A decisive breakout above this barrier would shift focus towards the 106.00 handle, which converges with a medium-term bearish trendline. A sustained move beyond these levels would signal a potential transition into a higher trading range.
- Support Levels: On the downside, should a market retracement occur, primary structural support is situated at 101.50. A breakdown beneath this support floor would bring the psychological 100.00 threshold into focus. A sustained break below these levels would likely trigger a deeper bearish correction.
- Momentum Indicators: Both the Moving Average Convergence Divergence (MACD) and the Relative Strength Index (RSI) are trending upward, suggesting that short-term bullish momentum could persist. Nonetheless, both indicators are currently in overbought territory relative to historical levels, signalling caution regarding the immediate sustainability of the bullish movement.
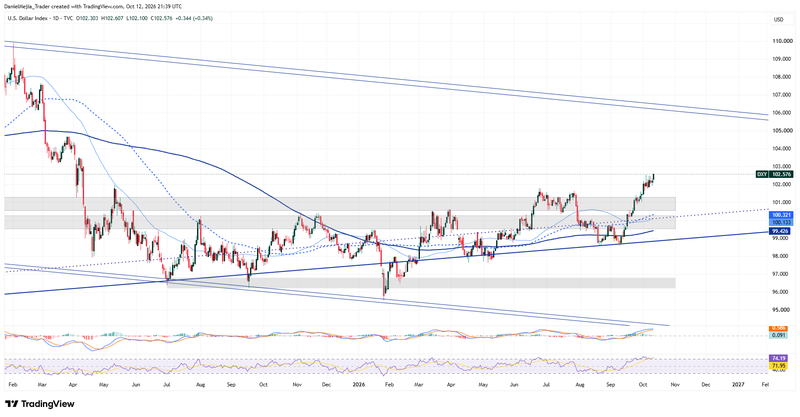
Figure 1. Dollar Index (2025–2026). Source: Intercontinental Exchange (ICE) data; author's analysis via TradingView.