Support
USD/MXN rises as diverging central bank policies support the US dollar
Diverging central bank policies, driven by a hawkish Federal Reserve and Banxico's interest rate cut, have pushed the USD/MXN pair up by 9.5% over the past two months, narrowing yield differentials and boosting demand for the US dollar.

The USD/MXN pair has risen by 9.5% since early September to 18.61, driven by divergent US and Mexican monetary policies.
The Federal Reserve raised interest rates to 4.00%, with market expectations pointing towards further hikes.
Banxico unexpectedly cut its benchmark interest rate by 25 basis points to 6.25%.
A narrowing yield gap of 2.25 percentage points has reduced the relative attractiveness of Mexican assets.
Date: 12 November 2026 (GMT+3)
Could diverging central bank policies drive USD/MXN higher?
The Mexican peso has depreciated significantly against the US dollar over the past two months. Since reaching its trough on 11 September, the USD/MXN currency pair has advanced by approximately 9.5%, currently trading at 18.61.
This trend has been primarily driven by diverging monetary policies between the US and Mexican central banks. Against this backdrop, the Federal Reserve has adopted a more restrictive monetary policy stance, raising its benchmark interest rate from 3.75% to 4.00%. Furthermore, market expectations point to a potential interest rate hike by the US central bank at its upcoming December meeting.
Conversely, Banco de México (Banxico) decided to cut its benchmark interest rate by 25 basis points last week to 6.25%, defying analysts' forecasts of an unchanged rate. This move demonstrates that the Mexican central bank is prioritising economic growth over price containment, even though headline inflation—currently standing at 3.75%—remains above Banxico's 3.00% target. Crucially, Mexican interest rates have maintained a downward trajectory over the past two years (see Figure 1).
Consequently, this monetary policy divergence continues to bolster the US dollar as investors reallocate capital towards US dollar-denominated assets in the bond market in pursuit of more attractive risk-adjusted returns. Notably, the interest rate differential between the US and Mexico has gradually narrowed, currently standing at 2.25 percentage points. Although Mexican government bonds continue to offer a nominal yield premium over US Treasuries, expectations of further monetary policy convergence may be diminishing the relative attractiveness of Mexican assets, thereby compounding downward pressure on the MXN.
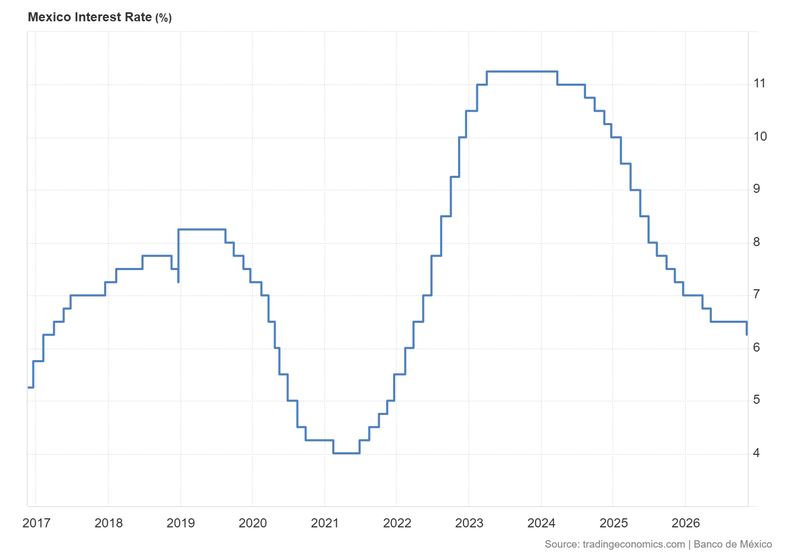
Figure 1. Mexico Interest Rate (2016–2026). Source: Data from Banco de México; chart retrieved via Trading Economics.
Technical analysis of the USD/MXN pair
From a technical perspective, the USD/MXN currency pair maintains strong bullish momentum. Key technical observations include:
- Trend Context: On the daily timeframe, the USD/MXN pair has exhibited sustained bullish momentum in recent months, trading comfortably above its 50-day, 100-day, and 200-day Simple Moving Averages (SMAs). Additionally, the market structure reveals a bullish crossover of the 50-day and 100-day SMAs above the 200-day SMA, signalling underlying reinforcement for US dollar demand.
- Momentum Indicators: Nevertheless, both the Moving Average Convergence Divergence (MACD) and the Relative Strength Index (RSI) are tracking downward trajectories from overbought territory. This indicator behaviour suggests that the pair could experience a price retracement or consolidation phase in the short term.
- Resistance Levels: Should the pair reinforce its bullish momentum, immediate resistance lies at 18.81 (the previous peak). If this level is breached to the upside, the next significant technical ceiling is 19.50, a market zone characterised by a High Volume Node (HVN).
- Support Levels: Conversely, should bearish momentum take hold, immediate support is located at 18.44—a zone where structural support converges with the Volume Profile's Value Area High (VAH). Should this level be breached to the downside, the next prominent support is 18.00, a key psychological barrier that aligns with the 50-day SMA.
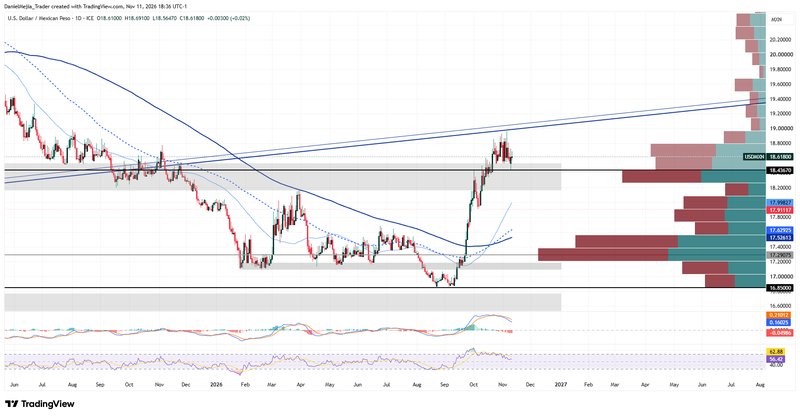
Figure 2. USD/MXN Exchange Rate (2025–2026). Source: Intercontinental Exchange (ICE) data; author's analysis via TradingView.