
 Support
 Oil price analysis: can Crude hold above $100
The U.S. crude market delivered a bearish signal this week. The API reported a 7.14-million-barrel increase in inventories for the week ending September 11, against expectations for a draw. Gasoline and distillate stocks also increased. Normally, that would put immediate pressure on crude.

Saudi Arabia has suspended the East-West pipeline.
The API reported a 7.14-million-barrel increase in inventories for the week ending September 11.
If oil loses 93.43 and falls back into the old breakout zone, the first level to watch would then be 84–87.
Saudi Arabia has lost its main route around Hormuz
Saudi Arabia has suspended the East-West pipeline, which carries oil from the country's eastern fields to Yanbu on the Red Sea. The route has become critical since disruption in the Strait of Hormuz forced Saudi Arabia to rely more heavily on its Red Sea export system. The pipeline had been carrying roughly 4–5 million barrels a day, with a maximum capacity of about 7 million.
The immediate impact is already showing up in physical markets. Saudi Arabia has cancelled some late-September crude cargoes to European buyers, forcing refiners to look for North Sea, U.S., Kazakh and other replacement barrels. Some European physical cargoes have moved above $130 a barrel, well above the front-month futures price.
That price gap tells us more than the futures market alone
Saudi Arabia can redirect some exports through alternative routes, but those options are more complicated and carry greater shipping risk. Yanbu stocks can cover only a limited period, while repairs to the damaged pipeline could take weeks depending on the extent of the damage.
This is why the 7.14 million-barrel U.S. inventory build has not broken the oil rally. American inventories say there is more crude available domestically. The physical market is saying that getting the right barrels to the right refinery is becoming harder.
There has also been speculation that Riyadh could use its oil leverage to increase pressure on Washington to change its approach to the war. There is, however, no confirmed evidence that the pipeline shutdown or cargo cancellations were ordered for that purpose. The Saudi government has described the pipeline closure as a response to the attack and a security measure.
For oil traders, the next variable is simple: how quickly Saudi Arabia restores the pipeline and whether alternative exports can replace the missing barrels. Until then, a large U.S. inventory build may not be enough to remove the supply premium from crude.
Hormuz traffic is collapsing again
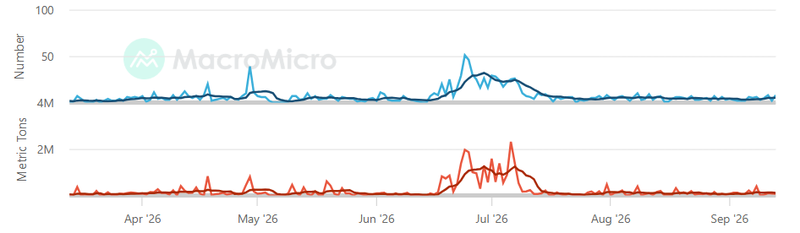
The latest shipping data shows just how much the conflict is changing the physical oil market. Only four vessels crossed the Strait of Hormuz on Tuesday, down from seven a day earlier and far below the 10-day average of 18. Two vessels entered and two left, while no very large crude carriers or LNG tankers were recorded. Some ships may have gone undetected after switching off their transponders, but the decline is still significant.
Fewer ships means fewer barrels moving through the world's most important energy chokepoint. That is why a large U.S. inventory build has struggled to remove the supply premium from crude. If traffic remains at these levels, the market will focus increasingly on how long Saudi Arabia and other Gulf producers can rely on alternative export routes.
Source: MacroMicro
Technical outlook
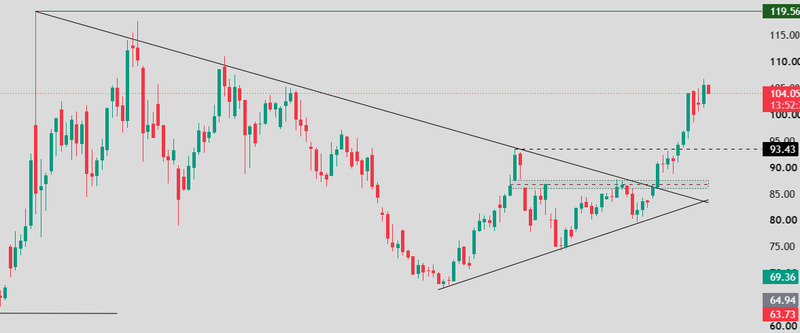
The decline from 119.56 has gradually lost momentum, with buyers stepping in at higher levels from the 69.36 low. That created a tighter range of higher lows and lower highs, leaving oil compressed inside a triangle. The recent break higher has taken price out of that range and shifted the chart back in favour of buyers.
This was not just a break of one resistance level. Oil moved through the 84–87 area, cleared the descending trendline and then pushed above 93.43. That sequence shows buyers were able to absorb the supply that had capped the market for months.
The next test is now below the market
93.43 is the level to watch on any pullback. If it holds, the breakout has a much better chance of turning into a sustained move rather than another failed rally. Above it, 100–105 becomes the next area to watch before the previous high at 119.56.
Scenarios ahead
Buyers need to hold 93.43 As long as oil stays above 93.43, the breakout remains intact. Holding that level would keep the new sequence of higher highs and higher lows in place and leave 100–105 as the next hurdle. A move through that area would put 119.56 back on the radar.
A move back below 93.43 would weaken the breakout
If oil loses 93.43 and falls back into the old breakout zone, the recent move would start looking less convincing. The first level to watch would then be 84–87. A deeper decline toward 69.36 would bring the triangle back into play and suggest the market has not yet made the longer-term shift buyers are looking for.
Source: TradingView


