Yen falls to a four-decade low amid persistent selling pressure
The yen fell to ¥161.90 per dollar, its weakest level since 1986, as wide Fed–BoJ rate differentials, US dollar strength, carry trades, and energy-driven inflation continued to pressure Japan’s currency.

USD/JPY rose by 0.11% to ¥161.90, the yen’s weakest level since 1986, amid persistent selling pressure.
Fed–BoJ policy divergence continues to support carry trades, with US rates at 3.75% versus Japan’s 1.0%.
Energy shocks and Japan’s 6.3% PPI have worsened import costs, inflationary pressures, and trade dynamics.
Japanese yen remains under pressure, trading at its lowest level in four decades
The Japanese yen has weakened to a multi-decade low against the US dollar, reflecting a combination of monetary policy divergence, external inflationary pressures, and heightened geopolitical uncertainty. The USD/JPY pair advanced by 0.11% to ¥161.90, marking a level last observed in 1986.
A key driver of the yen’s depreciation has been the wide interest rate differential between the United States and Japan. While the Federal Reserve’s policy rate stands at 3.75%, the Bank of Japan maintains a significantly lower rate of 1.0%. This divergence continues to support carry-trade strategies, as investors borrow in yen at relatively low funding costs and allocate capital to higher-yielding US dollar assets.
Pressure on the yen has been further amplified by the Federal Reserve’s more restrictive policy tone, which has raised expectations that US interest rates could remain elevated, or even increase, in upcoming meetings. By contrast, although the BoJ has started to normalise monetary policy, its tightening cycle remains gradual. This asymmetry has reinforced dollar strength and reduced the yen’s relative attractiveness.
At the same time, the energy shock associated with escalating tensions in the Middle East has added to Japan’s inflationary challenges. As a net energy importer, Japan is highly exposed to increases in global energy prices, which feed directly into import costs and weaken the trade balance. These pressures have been reflected in producer prices, with Japan’s PPI rising to 6.3% in May, its highest reading since March 2023.
Consequently, the yen remains vulnerable to both external price shocks and unfavourable yield dynamics. In periods of economic instability, investors tend to reallocate capital towards assets perceived as safer and offering more attractive returns. In the current environment, the US dollar has benefited from both its higher yield profile and safe-haven status, as well as from the relative strength of the US economy. Meanwhile, the yen has continued to face downward pressure.
Technical analysis of the USD/JPY pair
From a technical perspective, the USD/JPY pair is currently exhibiting bullish momentum. Key observations include:
- Trend context: In the long term, the pair maintains a technically bullish structure, defined by higher highs and higher lows, while currently surpassing a key resistance level.
- Resistance levels: Should the immediate short-term resistance at ¥162 be breached to the upside, the next significant technical ceiling is the ¥163 psychological level. A decisive break above this zone would signal the potential for a further extension into higher price territory.
- Support levels: If the short-term support at ¥160 is invalidated, the next critical floor is identified at ¥157. This level serves as the lower boundary of the bullish channel pattern and is currently situated near the 200-day moving average. A breach of the ¥157 zone would significantly increase the probability of a deeper market correction.
- Momentum indicators: The Moving Average Convergence Divergence (MACD) is following a rising trajectory, suggesting that bullish momentum could continue. Conversely, the Relative Strength Index (RSI) is currently trading near overbought territory, indicating possible resistance to further upside movement.
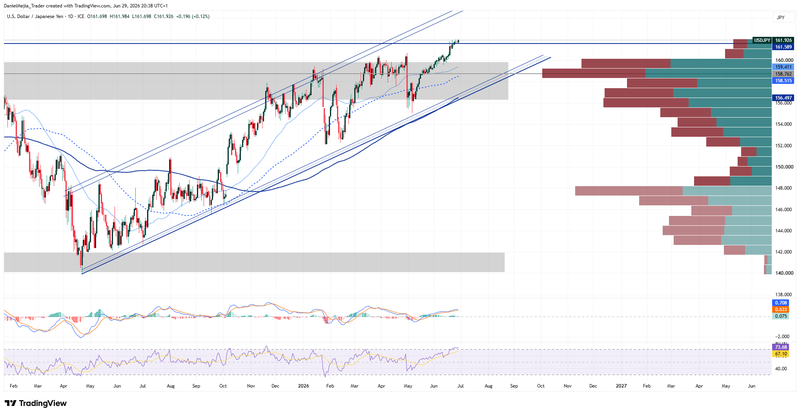
Figure 1. USD/JPY Pair (2024–2026). Source: Data from the Intercontinental Exchange (ICE); own analysis conducted via TradingView.


