ATR indicator: how traders use volatility to set stops and targets
The ATR indicator, short for average true range, is a volatility indicator that helps traders understand how much an asset typically moves over a certain period. It does not show whether price is likely to rise or fall. Instead, it shows how active or quiet the market is.

ATR stands for average true range.
Traders often use ATR to set stop-loss distance, profit targets, trailing stops, and position size.
ATR can help traders avoid stops that are too tight for current volatility.
It measures volatility, not trend direction.
What the ATR indicator measures
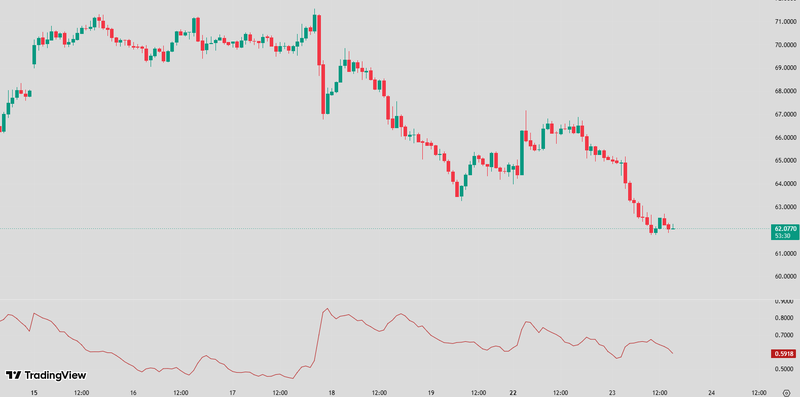
ATR measures how much price moves over a selected period.
It does not tell traders whether to buy or sell. It simply shows the average size of price movement. If ATR is rising, the market is becoming more volatile. If ATR is falling, the market is becoming calmer or more compressed.
This is useful because markets do not move with the same rhythm all the time. Gold, oil, indices, forex pairs, and individual stocks can all shift between quiet phases and fast-moving phases. A stop-loss that works during a calm session may be too tight during a volatile session.
ATR gives traders a way to adjust. Instead of placing stops randomly, they can use recent volatility as a guide. That does not guarantee a better trade, but it can make the risk plan more realistic.
Source: Trading view
ATR as a volatility gauge
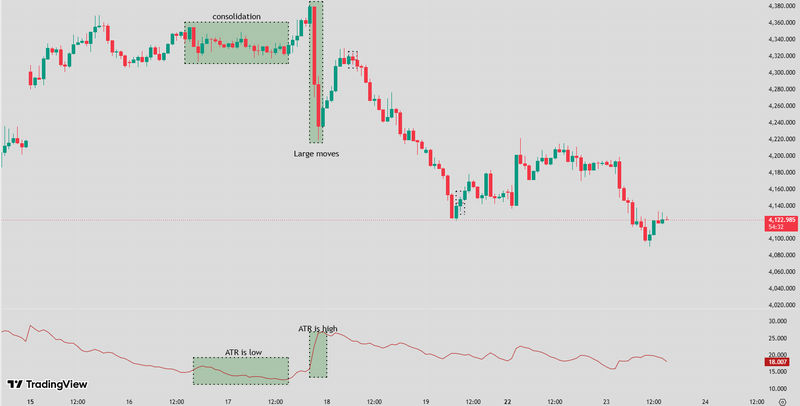
ATR is best understood as a volatility gauge.
When ATR is high, price is making larger moves. That may happen during news events, earnings releases, central bank decisions, geopolitical stress, or strong market trends. In these periods, traders may need wider stops and smaller position sizes to keep risk controlled.
When ATR is low, price is moving in a narrower range. This can happen during consolidation, low-volume sessions, or periods before major data releases. A low ATR can sometimes come before a breakout, but it does not predict the breakout direction.
Source: Trading view
How average true range works
Average true range works by measuring the market’s true range over multiple periods, then averaging those values.
The reason it uses true range rather than a simple high-low range is that markets can gap. A normal range only looks at the current high and low. True range also considers the previous close, which gives a better picture of real movement when price opens above or below the prior session.
This makes ATR useful across different markets. Stocks can gap after earnings. Commodities can jump after news. Forex can move sharply around economic data. ATR captures more of that movement than a basic candle range.
True range components: gap and intraday movement
The first is the current high minus the current low. This captures normal intraday or intra-candle movement. The second is the distance between the current high and the previous close. The third is the distance between the current low and the previous close.
This matters because price does not always move smoothly from one candle to the next. If a stock closes at 100 and opens the next day at 105, the high-low range alone may miss part of the real movement. True range includes that gap.
That is why ATR is more useful than a simple average candle size. It tries to measure the full movement traders actually experience, including gaps and sharp changes between sessions.
ATR calculation and common lookback periods
ATR is calculated by averaging true range values over a selected lookback period.
The most common setting is 14 periods. On a daily chart, that means ATR looks at the average true range over the last 14 days. On a one-hour chart, it looks at the last 14 hourly candles. The timeframe changes the meaning, but the logic stays the same.
A shorter ATR setting reacts faster to volatility changes. That may help active traders, but it can also become noisy. A longer ATR setting is smoother, but it reacts more slowly when market conditions change.
There is no perfect lookback period for every trader. The right setting depends on the market, timeframe, and trading style. Many traders start with 14 periods, then adjust only if they have a clear reason.
How traders use ATR to set stop-loss orders
ATR is widely used for stop-loss placement because it helps traders account for normal market movement.
A common mistake is placing stops too close to entry. If the market usually moves 50 points in a normal session, a 10-point stop may be hit by ordinary noise rather than a real failure of the trade idea. ATR helps traders avoid that problem by showing how much movement is normal.
For example, if ATR is 20 points, a trader may decide that a stop needs to be at least one ATR away from entry, depending on the setup. A wider stop does not mean taking more risk automatically. The trader can reduce position size so the money at risk stays controlled.
Source: Trading view
ATR-based stops using multiples: 1x, 1.5x, 2x
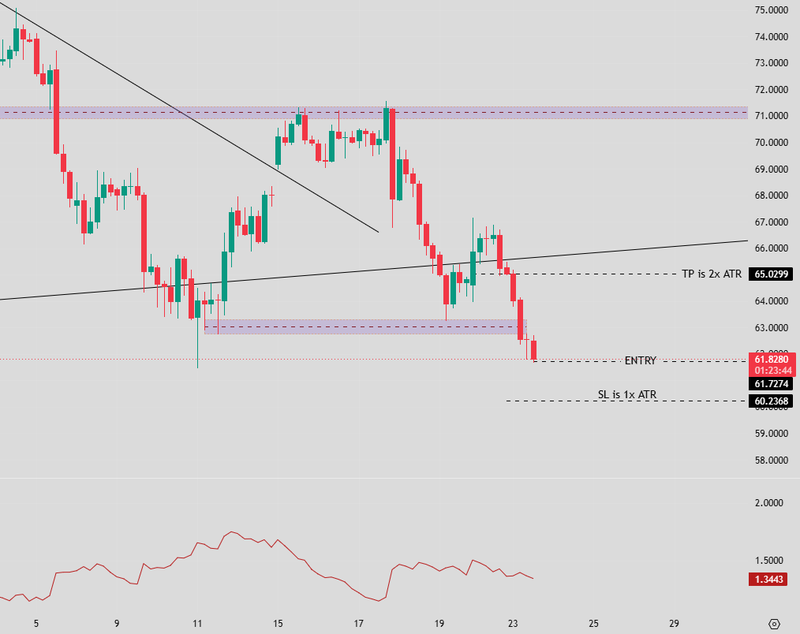
Traders often use ATR multiples to set stop-loss distance.
A 1x ATR stop means the stop is placed one ATR away from entry. A 1.5x ATR stop gives the trade more room. A 2x ATR stop is wider and may suit more volatile markets or longer-term trades.
The right multiple depends on the strategy. A short-term trader may use a smaller multiple. A swing trader may need a wider one because the trade is expected to move through more noise.
The important point is consistency. ATR multiples help traders avoid random stops. Instead of saying “this level feels right,” they can say “this stop reflects current volatility.” That makes the risk plan easier to test and improve.
How traders use ATR to set targets and exit levels
ATR can also help traders set profit targets and exit levels.
If a market usually moves 30 points per day, expecting a 150-point move in one session may be unrealistic unless there is a major catalyst. ATR helps traders judge whether a target is reasonable compared with current volatility.
Some traders use ATR-based targets by projecting a multiple of ATR from entry. For example, a trader may look for a 1.5x or 2x ATR move if the setup has enough momentum. Others use ATR to trail stops as the trade moves in their favour.
Source: Trading view
ATR-based profit targets and trailing stops
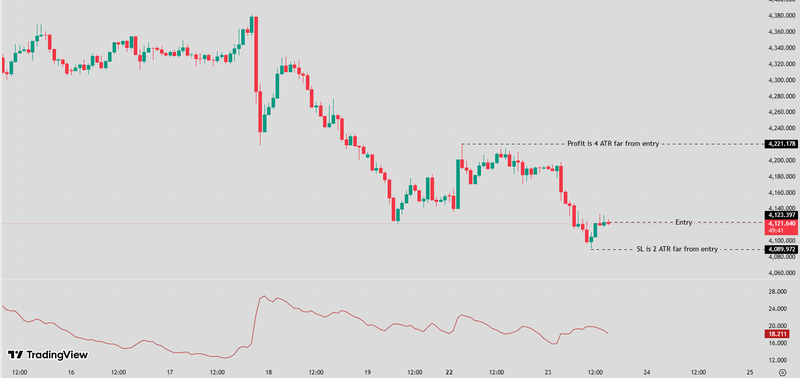
ATR-based targets use volatility to estimate how far price may reasonably move.
For example, if ATR is 25 points, a 1x ATR target would be 25 points from entry, while a 2x ATR target would be 50 points away. These levels are not predictions. They are volatility-based reference points.
ATR trailing stops work differently. Instead of using a fixed stop, the stop adjusts as price moves. In a long trade, the stop may trail below price by a set ATR multiple. In a short trade, it may trail above price.
This can help traders stay with a trend while still managing risk. But ATR trailing stops can lag, especially during sharp reversals. That is why many traders combine them with structure, such as swing highs, swing lows, or support and resistance.
Integrating ATR into a trading strategy
ATR works best when it is part of a wider trading strategy.
It can help with stop placement, targets, trailing exits, and position sizing. But it does not tell traders which direction to trade. A high ATR simply means price is moving more. It does not say whether buyers or sellers are in control.
This is why ATR should be combined with tools that read direction and confirmation. Trend structure, moving averages, support and resistance, volume, and momentum indicators can all help traders decide whether a setup is worth taking. ATR then helps shape the risk around that setup.
Position sizing using ATR
ATR can help traders adjust position size to match volatility.
If ATR is high, the stop-loss distance may need to be wider. A wider stop means the position size should usually be smaller if the trader wants to keep the same amount of money at risk. If ATR is low, the stop may be closer, which can allow a larger position size without increasing the planned risk.
For example, a trader risking a fixed amount per trade may use ATR to decide stop distance first, then calculate position size based on that distance. This keeps risk more consistent across different market conditions.
Combining ATR with trend and volume signals
ATR becomes more useful when combined with trend and volume signals.
A rising ATR during a breakout can suggest that volatility is expanding. If that breakout also comes with strong volume and a clear trend structure, the move may have more participation behind it. A rising ATR without trend confirmation, however, may only show disorder or news-driven volatility.
Moving averages can help define direction. Volume can help confirm participation. RSI or MACD can help show momentum. ATR then adds the volatility layer.
The goal is not to crowd the chart with indicators. The goal is to give each tool a job. Trend tools show direction. Volume shows participation. Momentum tools show strength. ATR shows how much the market is moving.
Common mistakes when using ATR for stops
The biggest mistake is using ATR as if it predicts direction.
ATR does not say whether price will rise or fall. It only shows how much price has been moving. A high ATR can appear during bullish rallies, bearish selloffs, or unstable sideways markets.
Another mistake is using the same ATR multiple in every market. A 1x ATR stop may work for one asset but be too tight for another. Timeframe also matters. ATR on a five-minute chart is not the same as ATR on a daily chart.
Traders should also avoid widening stops without reducing position size. A wider stop can make sense in a volatile market, but only if the risk amount is still controlled.
FAQs
What is the ATR indicator?
The ATR indicator, or average true range, is a volatility indicator that shows how much an asset typically moves over a selected period. It does not show trend direction or tell traders whether to buy or sell. Its main use is to help traders understand market movement and set more realistic stops, targets, and position sizes.
What does ATR measure?
ATR measures volatility. It shows the average range of price movement over a chosen number of candles or periods. A rising ATR means price is moving more widely, while a falling ATR means price is becoming quieter. Traders use this information to adjust risk, stop-loss distance, and expectations for potential price movement.
Is ATR a trend indicator?
No, ATR is not a trend indicator. It measures volatility, not direction. A high ATR can appear during an uptrend, a downtrend, or a volatile sideways market. Traders usually combine ATR with trend tools such as moving averages, market structure, or volume signals to understand both direction and movement strength.
How is ATR calculated?
ATR is calculated by averaging the true range over a selected lookback period, often 14 periods. True range considers the current high-low range and any gap from the previous close. This makes ATR more useful than a simple candle range because it captures both intraday movement and price gaps between sessions.
Is ATR useful for forex trading?
Yes, ATR is useful in forex trading because currency pairs move with different levels of volatility. A quiet pair may need tighter stops, while a fast-moving pair may need more room. ATR helps traders compare volatility across pairs and adjust their stop-loss, target, and position size more realistically.


