Support
Donchian channel strategy: how to trade breakouts and trends
The Donchian Channel strategy identifies breakouts and trends by evaluating highs, lows, and an average over N periods. The indicator focuses on breakout, follow-through, and retracement strategies, the accuracy of which can be optimised through analysis combined with other technical indicators such as volume, simple moving averages (SMAs), or the Average Directional Index (ADX).
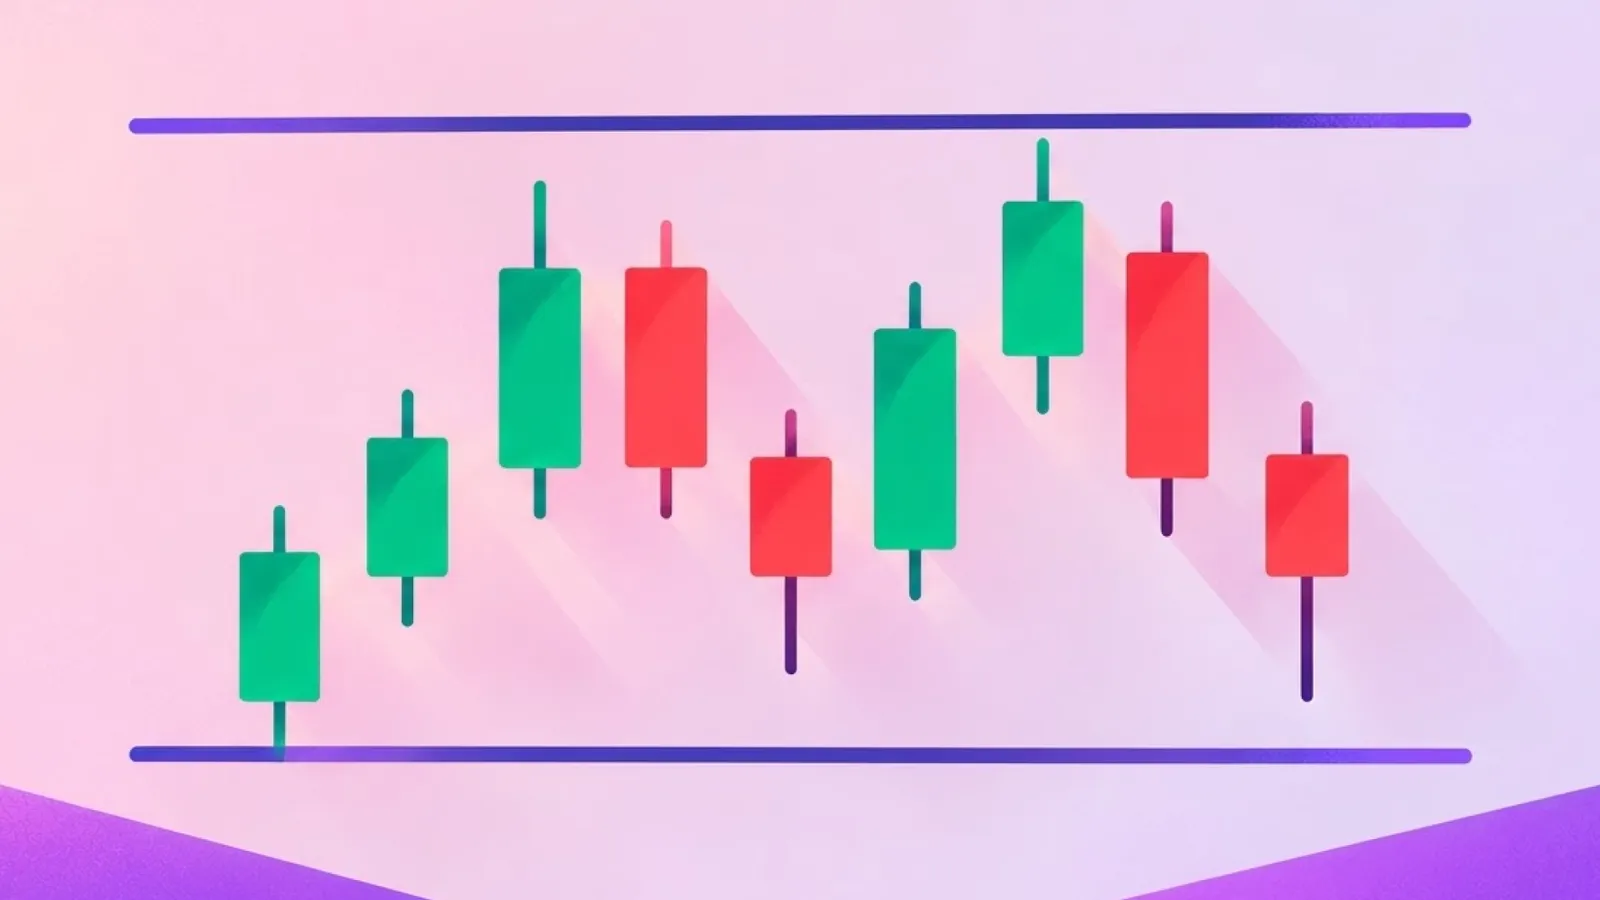
The indicator plots bands based on the high and low prices over N periods, incorporating a middle line that functions as an equilibrium level.
It enables the identification of trends through stepped structures and the execution of bullish or bearish breakouts following accumulation or distribution phases.
To mitigate false breakouts during periods of consolidation, it is advisable to validate entries using volume filters, the 200-period SMA, or the ADX indicator.
The calibration of the N parameter must be adapted to the trader's system and profile in order to enhance performance results.
What is the Donchian channel strategy?
The Donchian Channel strategy is a technical trading framework that utilises high, low, and an average over a specified period to identify price breakouts and underlying directional trends. Whilst the primary purpose of the indicator is trend analysis, it offers versatile applications across various domains of technical analysis and market trading.
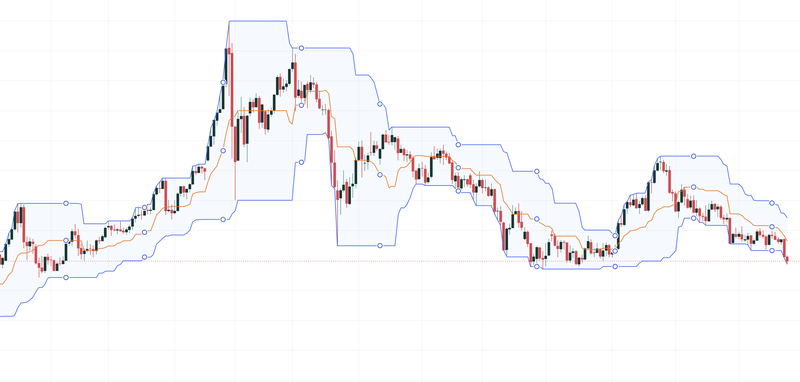
Figure 1. Donchian Channels (Example). Source: Own analysis conducted via TradingView.
Mathematical structure of the Donchian channel strategy
Unlike several technical indicators that incorporate smoothing transformations or lag-inducing algorithms, the Donchian Channel strategy relies on identifying peak high and trough low price levels within a defined time window, calculating a simple average between these two extremes.
How is it calculated?
To calculate the Donchian Channel strategy, three core parameters must be identified:
- Upper band (UB) = max(last N periods)
- Lower band (LB) = min(last N periods)
- Mid-Band (MB) = UB + LB / 2
Where N represents the number of periods within the chosen time window. For example, if a 20-period window is selected on a daily timeframe, the Donchian Channel strategy identifies and plots the maximum high of the last 20 days, the minimum low of the last 20 days, and the midpoint average of both values.
Interpretation of the Donchian channel strategy
The interpretation of the Donchian Channel strategy encompasses several critical technical dynamics, including:
- Understanding and Expanding Volatility: When the upper and lower bands contract towards one another (narrow bands), the market reflects periods of diminished volatility or consolidation. Conversely, when the bands expand, the market enters a period of heightened volatility.
- Trend Identification: The Donchian Channel strategy is a valuable tool for identifying sustained trends. During a bullish expansion phase, the indicator displays an ascending stepped structure due to the consecutive formation of higher highs and higher lows. In contrast, a descending stepped structure highlights a prevailing downtrend.
- Behaviour of the Middle Band: The middle band represents the equilibrium point between the extreme bands. In healthy, established trends, market corrections or retracements frequently test this level before resuming the dominant directional movement.
Types of trading using the Donchian channel strategy
The Donchian Channel strategy supports several operational trading models, among which the following are most prominent:
Breakout strategy
The breakout strategy represents the classic and most widely deployed model. This operational approach assumes that price penetrating either band signifies a potential influx of institutional liquidity, marking the conclusion of an accumulation or distribution phase.
Under this strategy, a bullish entry rule requires the closing price of a candlestick to pierce above the upper band of N periods. Conversely, a bearish entry is triggered when the closing price breaks beneath the lower band of N periods.
Trend following
The Donchian Channel strategy allows traders to visualize trends cleanly through stepped price structures. These structures can be ascending or descending, reflecting upward or downward trends respectively.
To execute this approach effectively, traders often deploy a dual-channel framework using two distinct timeframes: one with longer-period settings to establish the macro trend and another with shorter-period parameters to manage trade exposure. As long as the lower-timeframe Donchian Channel maintains a stepped structure aligned with the primary trend—without price breaching the opposing band—the position can remain active. Should a breach of that critical level occur, the position is liquidated, as it signals a weakening or reversal in market momentum.
Pullback strategy
In a pullback strategy, following an initial breakout beyond an extreme boundary (high or low), the trader awaits a corrective price retracement towards the middle band or back to the recently broken upper or lower band (which then acts as converted support or resistance). This approach offers an enhanced risk-to-reward ratio by securing entry at a more favourable discount level.
Using the Donchian channel strategy with other indicators and parameter calibration
The overall efficacy of the Donchian Channel strategy depends significantly on the trader's objectives, which can be optimized by combining the channel with complementary indicators or by fine-tuning its parameters.
Filters with complementary indicators to prevent false breakouts
Combining the Donchian Channel strategy with secondary technical indicators improves signal accuracy, particularly during market consolidations where false breakouts are common. The following indicators provide valuable confluence:
- Volume Confirmation Filter: This filter requires the volume on the breakout candlestick (piercing the upper or lower band) to be substantially higher than the moving average volume over the preceding N periods.
- Moving Average Trend Filter: This confluence ensures that trades taken via the Donchian Channel strategy align with the broader market trend. For example, a long position triggered by an upper-band breakout should ideally occur whilst price trades above the 200-period Simple Moving Average (SMA), confirming alignment with the prevailing macro uptrend.
- Directional Strength Filter via ADX: This filter validates that entries are supported by an Average Directional Index (ADX) reading above 25 points. The objective of this combination is to confirm strong directional momentum and institutional involvement prior to market entry.
Calibration of parameters across different operating timeframes
Calibrating the parameters of the Donchian Channel strategy aligns the indicator with specific trading styles and risk management requirements. Adjusting the N-period parameter carries several operational implications:
- 20-Period Setting: The standard default for the Donchian Channel strategy is 20 periods. This setting offers an effective balance between signal responsiveness and noise reduction across various asset classes, making it particularly suitable for swing trading strategies.
- 10- to 15-Period Settings: Selecting an N between 10 and 15 increases signal frequency and sensitivity to brief volatility spikes. Due to its dynamic nature, this configuration is often applied in scalping strategies. However, whilst it increases trading opportunities, it can also lead to higher transaction costs due to frequent entries.
- 30+ Period Settings: Setting N above 30 periods enhances entry quality by filtering out minor price fluctuations, though signal frequency decreases noticeably. Consequently, this configuration is preferred for position trading across weeks or months, as well as in highly volatile markets prone to frequent whipsaws and false breakouts.
Conclusion
The Donchian Channel is a versatile and straightforward tool for structuring systematic trading strategies around breakouts and trends. Its core strength lies in its mathematical simplicity, although it could require pairing with confirmatory indicators—such as volume, moving averages, or the ADX—to filter out false signals during range-bound conditions. Adapting period settings to specific timeframes enables traders to align their risk management protocols directly with their overarching trading objectives.
If you're interested in trading indices, foreign exchange, shares, or commodities, consider exploring the CFD contracts offered by Equiti Group. Please note that trading leveraged derivatives involves a high level of risk and may not be suitable for all investors.
FAQs
What is the Donchian Channel and what is its basic principle?
It is a technical analysis indicator that calculates maximum high and minimum low prices alongside their midpoint average over a specified timeframe (N). Unlike many other technical tools, it does not apply smoothing techniques or introduce calculation lag. Its primary purpose is to identify price breakouts, measure market volatility, and highlight underlying trends clearly and directly.
How do you interpret volatility and trend with this indicator?
Volatility is measured by the width between the upper and lower bands: narrow bands indicate volatility compression, whereas expanding bands signal volatility expansion. Trends are identified through ascending (bullish) or descending (bearish) stepped structures. The middle band serves as an equilibrium baseline where price pullbacks frequently occur before the market resumes its dominant direction.
What are the main operational strategies that it allows to be implemented?
Three primary strategies stand out: the breakout strategy, which identifies entry points when price pierces the upper or lower band following accumulation or distribution phases; trend following, which manages active positions using stepped price structures; and the retracement (pullback) strategy, which waits for corrective moves back to the middle to achieve a more favourable entry price.
How do you optimize the indicator and minimize false breakouts?
To filter out false signals within consolidation ranges, the Donchian Channel strategy can be combined with volume indicators, simple moving averages, or the ADX indicator. Furthermore, its input parameters can be calibrated to match specific operational styles: 10 to 15 periods for scalping, 20 periods (standard) for swing trading, and 30+ periods for long-term position trading.