Support
A trader’s guide to read equal highs and equal lows
Equal highs and equal lows are widely followed in Smart Money Concepts (SMC) because they can highlight areas where orders are clustered. This article shows how traders use them to identify liquidity, rather than just chart patterns.
In Smart Money Concepts (SMC), equal highs and equal lows can highlight areas where liquidity is building.
Many retail traders see these levels as traditional double tops or double bottoms.
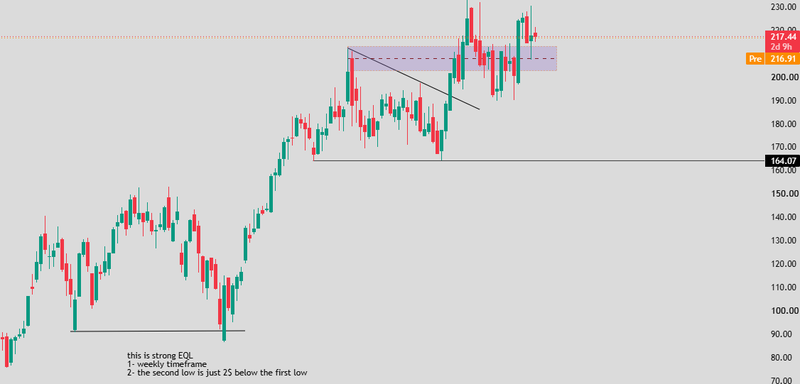
Higher-timeframe EQH and EQL usually attract more liquidity than lower-timeframe levels.
Price may sweep these areas before the next move becomes clearer.
A liquidity sweep does not always mean price will reverse, which makes confirmation essential.
What are equal highs and equal lows?
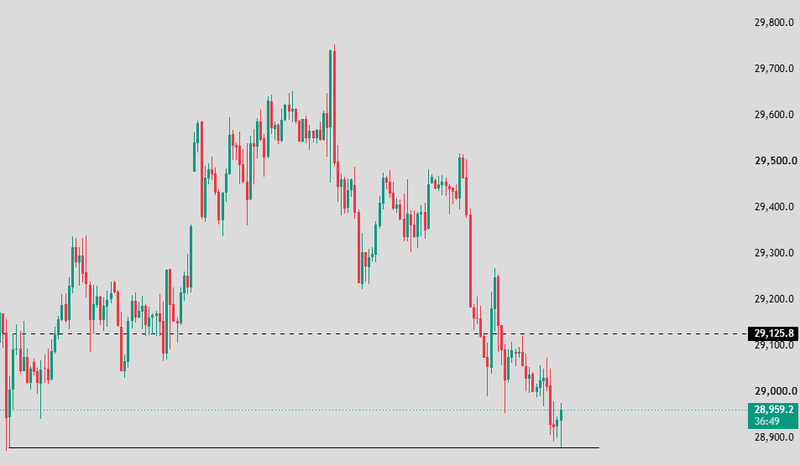
Equal highs form when price reaches roughly the same high more than once without creating a decisive breakout. Equal lows form when price repeatedly holds around the same low.
On a retail chart, these patterns are commonly treated as resistance and support. A trader may sell near equal highs expecting another rejection or buy near equal lows expecting another bounce.
SMC interprets these levels differently. Instead of focusing only on whether the level will hold, traders ask what orders are likely sitting around it.
When many traders react to the same obvious level, they often place their stop-losses and breakout orders in similar locations. Those clustered orders create liquidity that price may target before making its larger move.
Source: Trading view
How to use ATR with equal highs and equal lows
The Average True Range (ATR) can make equal highs and equal lows much easier to trade because it adds a volatility filter. Instead of assuming every sweep will reverse, ATR helps traders judge whether price has moved far beyond the liquidity pool to create a meaningful reaction.
When ATR is low, price often makes shallow sweeps around EQH and EQL before returning into the range. In these conditions, a small move beyond the highs or lows may simply be normal market noise rather than a true liquidity grab. When ATR is high, sweeps tend to be deeper and more aggressive, especially during London and New York sessions or around major news releases.
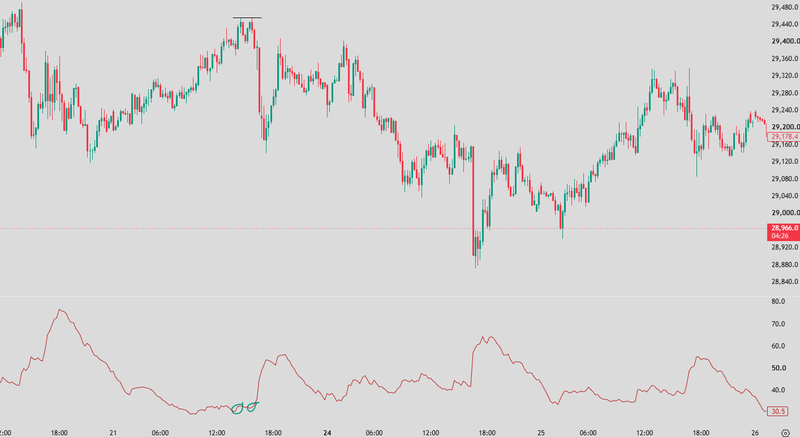
One practical approach is to compare the sweep with the current ATR reading. For example, in below chart the 15-minute ATR is around 32 pips, a sweep of only 2 or 3 pips above equal highs may not be significant enough to signal trapped buyers. A sweep covering a larger portion of the ATR, followed by strong displacement back inside the range, often carries more weight because it shows that the market expanded beyond its normal movement before reversing.
ATR is also useful for managing risk around these liquidity pools. Placing a stop directly on top of equal highs or directly below equal lows often leaves it inside the area where liquidity is concentrated. Using an ATR buffer beyond the swept wick gives the trade more room to survive normal volatility while keeping the invalidation level tied to the market's structure rather than an arbitrary number of pips.
Source: Trading view
Retail vs. Smart Money: Two different ways of seeing the same chart
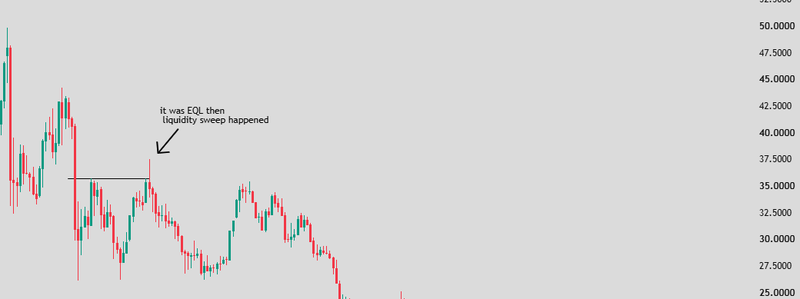
A retail trader usually looks at equal highs and sees resistance. If price breaks above it, they expect a bullish breakout. If it fails, they see a double top.
A Smart Money trader looks at the same level and asks where liquidity is being built. Imagine price reaches the same high three times over several days. Retail traders may keep selling that resistance, placing their stop-losses just above it. Breakout traders may place buy-stop orders above the highs, waiting for a breakout.
Both groups create a concentration of orders above the level
From an SMC perspective, that area becomes attractive because it contains liquidity that larger market participants may interact with before the next meaningful move develops. The same logic applies to equal lows, where long traders often place protective stops below support while breakout sellers wait for a downside break.
Source: Trading view
How to identify equal highs and equal lows
One of the biggest misconceptions is that equal highs must be identical down to the last pip. Markets rarely behave that perfectly. Instead, traders look for tight price clusters where multiple highs or lows form within a small range.
Wicks vs. bodies
Wicks usually matter more than candle bodies because they show where price traded before rejecting the area.
For example, if three candles leave upper wicks within a few points of each other, many traders would still consider that a valid equal-high structure even if the candle closes differ slightly. The same principle applies to equal lows, where several lower wicks repeatedly defend the same area.
Acceptable tolerance
Markets are not perfectly symmetrical. A practical approach is to treat equal highs and lows as zones rather than exact prices. If several swing highs form within a narrow range, they can still represent the same liquidity pool even if they are separated by a few points or pips. This helps traders avoid becoming overly precise when the market itself is not.
Why higher timeframes matter more
Not all liquidity pools carry the same weight. Equal highs on a one-minute chart may attract short-term traders, but equal highs on a four-hour or daily chart often attract swing traders, funds, and larger market participants.
The longer a level remains visible, the more likely it is to accumulate orders
A daily EQH that has held for two weeks is naturally watched by more traders than a one-minute level that formed ten minutes ago. That broader participation often creates a larger liquidity pool. Many traders therefore build their bias from higher-timeframe EQH and EQL, then use lower timeframes to refine entries after price reaches those areas.
Source: Trading view
What lives above equal highs and below equal lows?
The reason these levels matter becomes clearer when you think about the orders sitting around them. Above equal highs, two types of orders commonly accumulate.
Short traders who sold resistance often place buy stop-losses above the highs to protect their positions. Breakout traders also place buy-stop orders above the same level, expecting bullish continuation once resistance breaks. Together, these orders create a concentration of buying liquidity.
Below equal lows, the opposite happens
Long traders usually place sell stop-losses below support, while breakout sellers place sell-stop orders beneath the lows. That creates a pool of sell-side liquidity waiting below the market.
Price does not have to reach these orders every time, but when it does, volatility often increases because many orders are triggered within a short period.
Why institutions are drawn to these liquidity pools
One of the core ideas in SMC is that large institutions cannot always enter enormous positions at a single price. Imagine trying to buy a very large position when few sellers are available. The price could move sharply higher before the order is filled, creating significant slippage.
Liquidity pools help solve that problem
When price reaches an area filled with stop-losses and breakout orders, many transactions happen quickly. That increased activity creates better conditions for executing larger orders.
This does not mean institutions simply hunt retail stops for the sake of it. The practical idea is that large orders require liquidity, and obvious price levels often provide more of it than random areas in the middle of a range.
How liquidity gets built over time
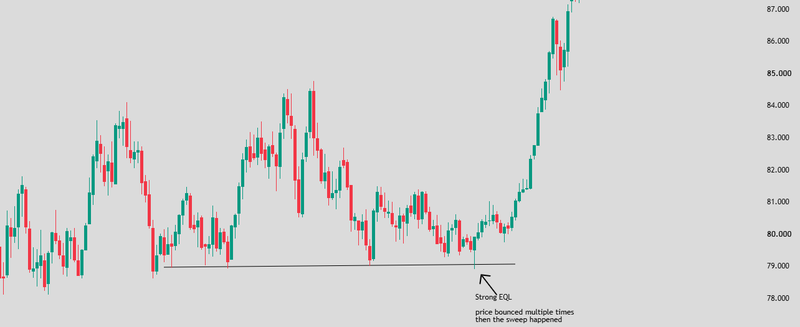
Equal highs and equal lows often become stronger because the market spends time reinforcing them. Imagine price rejecting the same high three or four times over several days. Every rejection increases confidence that the level matters.
More traders begin selling there. More stop-losses appear above it. More breakout orders gather beyond it.
Over time, the liquidity pool becomes larger
A similar process happens below repeated lows, where buyers continue defending support while protective stops accumulate underneath.
Whether this develops naturally through repeated market reactions or through broader order-flow dynamics, the result is the same: the longer a clean EQH or EQL remains visible, the more attention it tends to attract.
Source: Trading view
How traders use EQH and EQL in SMC
SMC traders rarely enter simply because equal highs exist. Instead, they often wait for price to interact with the liquidity pool first.
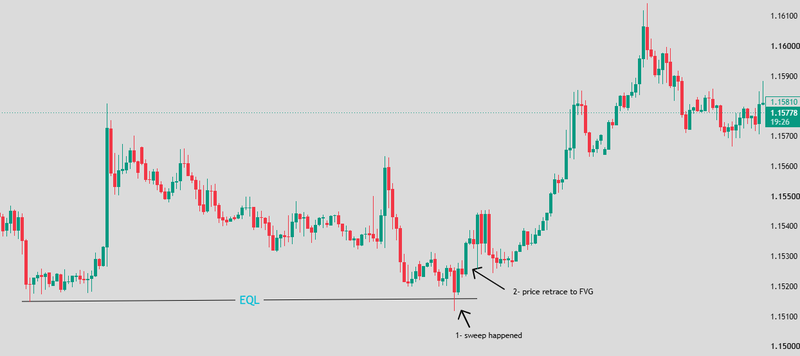
A common bullish sequence begins with price sweeping equal lows, rejecting the level, showing bullish displacement, and then retracing into a fair value gap or order block before continuing higher.
A bearish sequence often starts with price sweeping equal highs, rejecting the breakout, breaking short-term structure, and then offering a retracement entry. The sweep itself is information, not necessarily the entry signal. The confirmation usually comes from the market's reaction afterward.
Source: Trading view
The risks of trading EQH and EQL
Equal highs and equal lows are useful reference points, but they are not guaranteed reversal zones. One of the biggest risks is assuming every sweep will reverse. Sometimes price breaks above equal highs because genuine buying pressure is strong enough to continue the trend.
Another common mistake is entering too early. Selling directly into equal highs before the liquidity sweep can expose traders to the very stop run they were trying to anticipate.
Lower-timeframe EQH and EQL also create more noise. Small liquidity pools on one-minute charts can be swept repeatedly without producing meaningful higher-timeframe moves.
Risk management remains essential. Traders should define invalidation levels, avoid treating every equal level as institutional activity, and always consider the broader market structure before making decisions.
FAQs
What are equal highs in trading?
Equal highs are two or more swing highs that form around the same price level. In Smart Money Concepts (SMC), they are viewed as buy-side liquidity pools because stop-losses from short traders and breakout buy orders often accumulate above them.
What are equal lows in trading?
Equal lows are two or more swing lows that form near the same price level. They are considered sell-side liquidity pools, as stop-losses from long traders and breakout sell orders tend to cluster below these levels.
Are equal highs the same as a double top?
Not exactly. A double top is a traditional chart pattern that often suggests a potential reversal. In SMC, equal highs are interpreted as a liquidity pool that price may target before deciding whether to continue or reverse.
Are equal lows the same as a double bottom?
No. A double bottom is a classic reversal pattern, while equal lows are viewed as an area where sell-side liquidity has built up. Price may sweep those lows before making its next move.
Why does price sweep equal highs and equal lows?
Price often moves through equal highs and equal lows because they contain large clusters of stop-loss and breakout orders. These liquidity pools can provide the market with the order flow needed before a stronger directional move develops.