Heikin-ashi trading strategy: how to trade with heikin-ashi candles
Heikin-Ashi candles are a charting method designed to make trends easier to read. Instead of showing every raw price movement like traditional Japanese candlesticks, Heikin-Ashi uses an average-based formula to smooth the chart. That smoothing can help traders see direction, momentum, and possible exhaustion more clearly.

Heikin-Ashi means “average bar” in Japanese.
The candles use a modified formula to smooth price action.
Strong trends often show large bodies with little or no opposite wick.
Small bodies with wicks on both sides usually suggest hesitation or consolidation.
What are Heikin-Ashi candles?
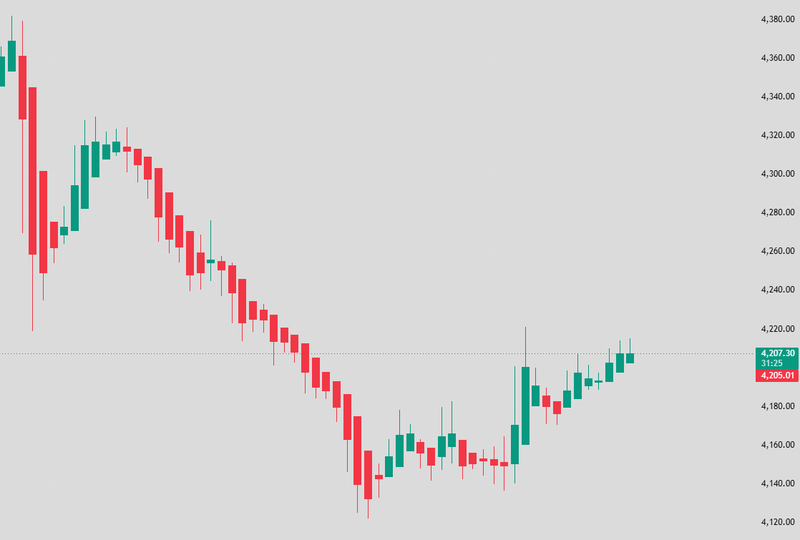
Heikin-Ashi candles are modified candlesticks that smooth price action to make trends easier to see.
Traditional Japanese candlesticks show the actual open, high, low, and close for each period. Heikin-Ashi candles are different. They use a calculation based on current and previous price data, which often keeps candle colour more consistent during a trend.
That is the main purpose of Heikin-Ashi. A normal chart may show several mixed candles during a small pullback, even when the wider trend is still intact. Heikin-Ashi reduces some of that visual noise, so traders can focus more on the broader direction.
But the smoothing can also delay signals. A Heikin-Ashi candle may look clean while the real market price has already started to change. That is why traders should understand it as a trend-reading tool, not a perfect entry tool.
Source: Trading view
Heikin-Ashi vs Japanese candlesticks
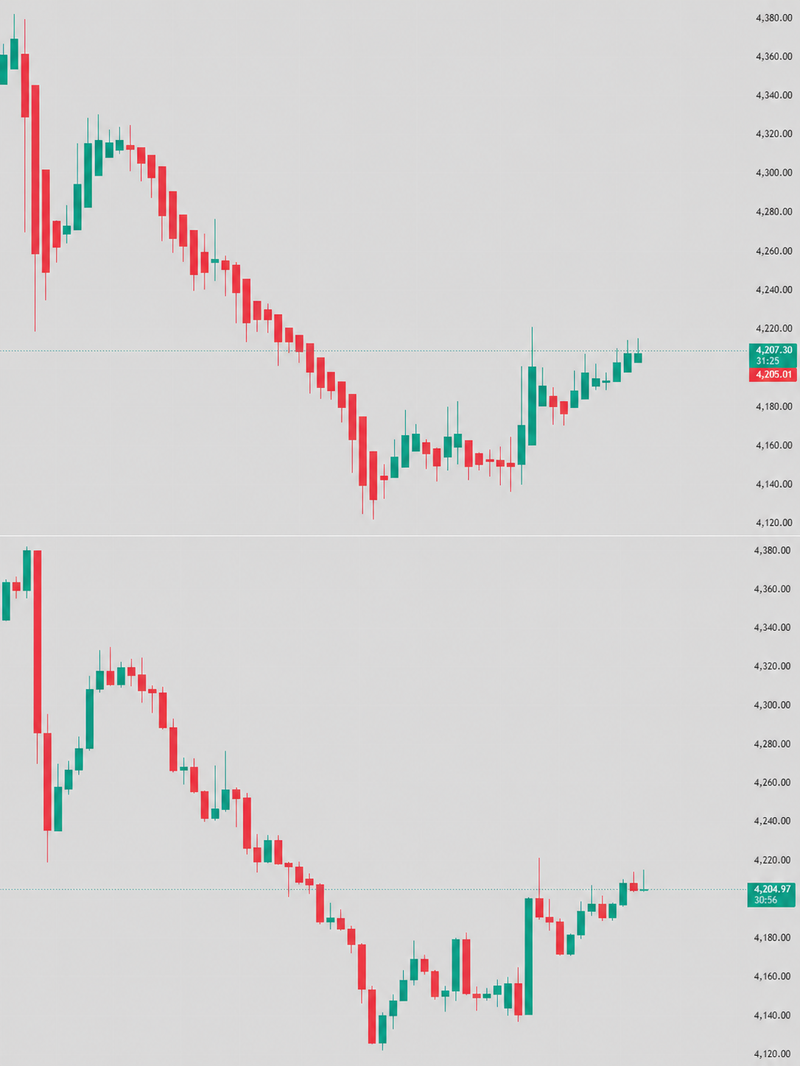
The main difference is that Japanese candlesticks show raw price, while Heikin-Ashi candles show a smoothed version of price.
A Japanese candle shows the real open, high, low, and close for that period. This makes it useful for precise entries, exits, and candlestick patterns. Heikin-Ashi candles are calculated using averages, so their open and close may not match the real market open and close.
This matters because a trader using Heikin-Ashi may see a clean trend, but still need normal candles or actual price levels for execution. Heikin-Ashi is cleaner. Japanese candlesticks are more exact. Neither is better in every situation.
Source: Trading view
When Heikin-Ashi works best: trending vs ranging markets
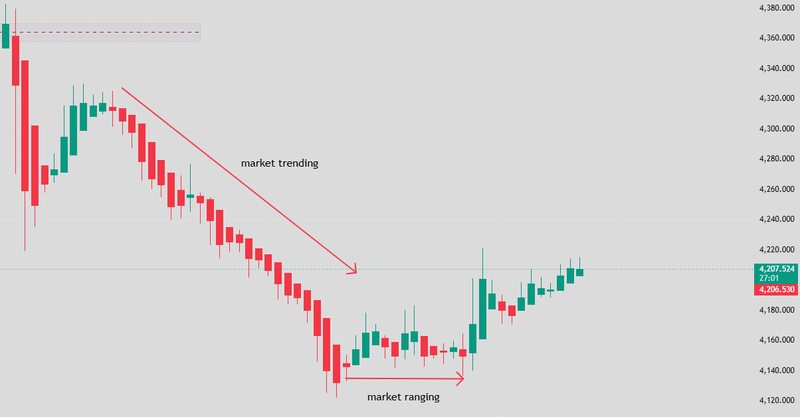
Heikin-Ashi works best when the market is trending clearly.
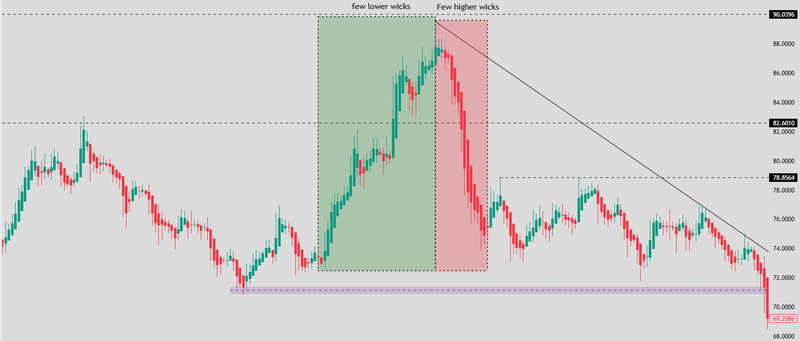
In a strong uptrend, it may show several bullish candles with strong bodies and small lower wicks. In a strong downtrend, it may show several bearish candles with strong bodies and small upper wicks. This helps traders stay with the move.
The problem comes when the market is ranging. In sideways markets, price moves back and forth without clear direction. Heikin-Ashi candles may change colour often, bodies may become smaller, and wicks may appear on both sides. That usually means momentum is weak or uncertain, not that every candle change should be traded.
Source: Trading view
How Heikin-Ashi is calculated
Heikin-Ashi is calculated using a modified open, high, low, and close.
This is why the candles look smoother than standard candlesticks. Each new candle is partly based on the previous Heikin-Ashi candle, not only the current raw price. That link between candles reduces some of the sharp changes that appear on normal charts.
The result is a chart that often shows trends more clearly. In an uptrend, candles may remain bullish for longer. In a downtrend, they may remain bearish for longer. This can help traders avoid overreacting to small pullbacks.
Heikin-Ashi open, high, low, close formula
The Heikin-Ashi formula changes how each candle is built.
The Heikin-Ashi close is usually the average of the current period’s open, high, low, and close. The Heikin-Ashi open is usually the average of the previous Heikin-Ashi open and previous Heikin-Ashi close. The high is the highest value among the current high, Heikin-Ashi open, and Heikin-Ashi close. The low is the lowest value among the current low, Heikin-Ashi open, and Heikin-Ashi close.
Open: (previous Heikin Ashi open + previous Heikin Ashi close) ÷ 2
Close: (current open + current high + current low + current close) ÷ 4
High: Maximum of current high, current Heikin Ashi open, or current Heikin Ashi close
Low: Minimum of current low, current Heikin Ashi open, or current Heikin Ashi close
How to read Heikin-Ashi candles and patterns
Reading Heikin-Ashi starts with candle colour, body size, and wick direction.
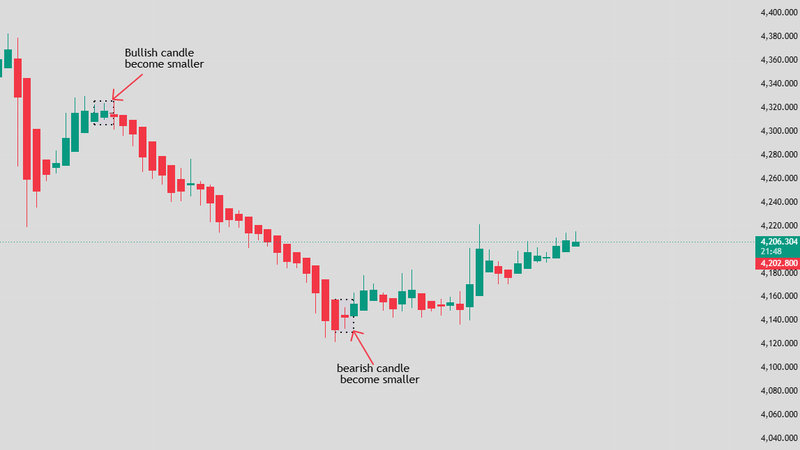
A strong bullish trend usually shows bullish candles with larger bodies and little or no lower wick. A strong bearish trend usually shows bearish candles with larger bodies and little or no upper wick. These patterns suggest that one side of the market is in control.
When candles become smaller, or wicks start appearing on both sides, the message changes. It may show that momentum is slowing, buyers and sellers are becoming more balanced, or the market is entering consolidation.
The key is to read candle sequences, not single candles. Are candles strong in one direction? Are bodies getting smaller? Are opposite wicks starting to appear? Has the candle colour changed after a long move? These questions give the signal more context.
Source: Trading view
Trend strength signals: no wicks and strong bodies
Strong Heikin-Ashi trends often show candles with large bodies and little or no wick against the trend.
In an uptrend, bullish candles with no lower wick suggest that sellers are not creating much pressure. Buyers remain in control, and the trend may still have momentum. In a downtrend, bearish candles with no upper wick suggest that buyers are weak and sellers are still driving price lower.
This is one of the clearest uses of Heikin-Ashi. It helps traders see whether a trend is strong enough to stay with. But strong candles still need context. A strong candle near major resistance or support may not carry the same meaning as one breaking out from a clean consolidation.
Source: Trading view
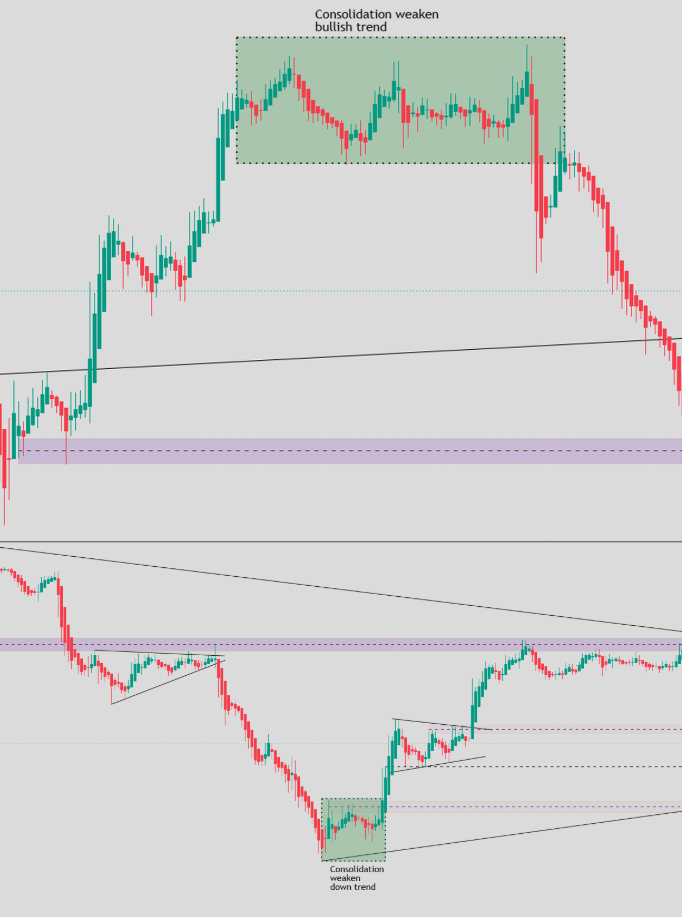
Consolidation and indecision signals: small bodies and both wicks
Small Heikin-Ashi bodies with wicks on both sides usually show indecision.
This means neither buyers nor sellers are fully in control. The market may be pausing after a strong move, consolidating, or preparing for a possible shift. These candles often appear when momentum is fading.
That does not always mean a reversal is coming. A market can pause and then continue in the same direction. So small candles should be treated as a warning, not a final signal.
For example, if a bullish trend starts printing small candles with upper and lower wicks, a trader may tighten risk, take partial profit, or wait for more confirmation before entering again.
Source: Trading view
Heikin-Ashi trading strategies
Heikin-Ashi can support different trading styles, but the core idea is usually the same: use the candles to read trend direction and momentum.
Some traders combine Heikin-Ashi with moving averages to define the broader trend. Others use it for swing trading, where the goal is to stay with a move for several candles or days. Some use it for scalping, although this needs caution because lower timeframes are more sensitive to spread, slippage, and fast reversals.
The best strategy depends on the market, timeframe, and risk tolerance. A Heikin-Ashi setup on a daily chart behaves very differently from one on a one-minute chart.
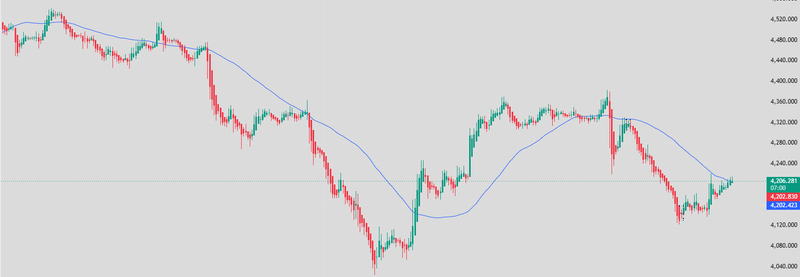
Heikin-Ashi moving average strategy
A common strategy combines Heikin-Ashi candles with a moving average.
The moving average helps define the broader trend. Heikin-Ashi helps show whether momentum agrees with that trend. If price is above a rising moving average and Heikin-Ashi candles are bullish with strong bodies, the uptrend may still be healthy. If price is below a falling moving average and candles are bearish, the downtrend may still be intact.
This approach helps filter weak signals. A bullish Heikin-Ashi candle below a falling moving average may only be a short-term bounce. A bearish candle above a rising moving average may only be a pullback.
Source: Trading view
Using Heikin-Ashi for swing trading
Heikin-Ashi can be useful for swing trading because it helps traders stay with trends for longer.
Swing traders often want to capture a larger part of a move rather than enter and exit constantly. Heikin-Ashi can help by smoothing short-term noise. If candles remain strong in one direction, the trader may decide to hold. If candles become smaller, develop opposite wicks, or change colour, the trader may become more cautious.
The benefit is discipline. Heikin-Ashi can stop traders from exiting too early during normal pullbacks. The risk is delay. If the market reverses sharply, the candle change may come after part of the move has already happened.
Scalping with Heikin-Ashi
Scalping with Heikin-Ashi is possible, but it needs caution.
On lower timeframes, Heikin-Ashi can make fast price action look smoother. This may help scalpers identify short bursts of momentum. But scalping depends heavily on exact price, spread, slippage, and execution speed.
Because Heikin-Ashi candles are smoothed, they may not show real-time price behaviour as clearly as normal candlesticks. For that reason, many scalpers use Heikin-Ashi for direction, but use normal price, support and resistance, or order flow tools for entry and exit.
Using Heikin-Ashi with other indicators
The main role of Heikin-Ashi is to make trend direction easier to read. It can show whether buyers or sellers are controlling the move, whether momentum is clean, and whether price is starting to lose strength. But it does not confirm volume, exact entry levels, volatility, or whether the trend is strong enough to continue.
That is why traders often use Heikin-Ashi with simple confirmation tools. Volume can help confirm whether a move has real participation. Moving averages can help define the broader trend. RSI can help show whether momentum is strengthening, weakening, or becoming stretched. ATR can help traders understand whether the market is moving enough to justify the stop distance.
The goal is not to make the chart crowded. The goal is to use each tool for a clear purpose. Heikin-Ashi shows trend rhythm. Other indicators help confirm whether that trend has enough strength behind it.
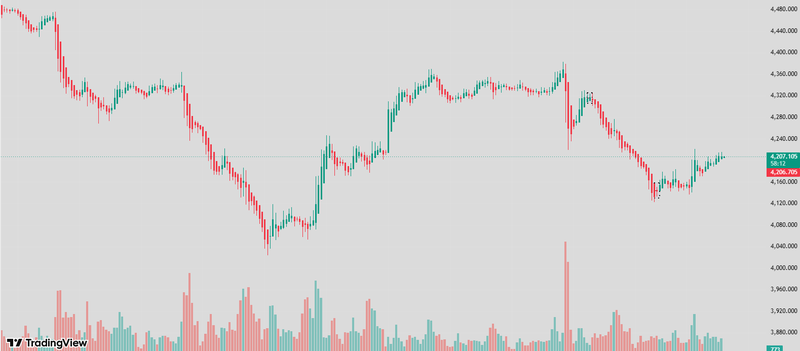
Volume confirmation for entries and exits
Volume can help confirm whether a Heikin-Ashi signal has real participation behind it.
For example, if Heikin-Ashi candles turn bullish after a pullback and volume starts rising, the move may have stronger support from buyers. If candles turn bullish but volume remains weak, the signal may be less reliable. The same idea applies in a downtrend. Bearish Heikin-Ashi candles with stronger volume may suggest sellers are more active.
Volume can also help with exits. If a trend continues but volume starts fading while Heikin-Ashi candles become smaller, it may suggest momentum is weakening. That does not always mean the trend will reverse immediately, but it can warn traders to manage risk more carefully.
The point is simple. Heikin-Ashi shows the shape of the move. Volume helps show whether traders are participating in that move.
Source: Trading view
Trend and momentum filters
Trend and momentum filters can help traders avoid weak Heikin-Ashi signals.
A moving average is one of the simplest trend filters. If price is above a rising moving average and Heikin-Ashi candles are bullish, the signal is more aligned with the broader trend. If price is below a falling moving average and Heikin-Ashi candles are bearish, the downtrend may still have control.
RSI can add momentum context. If Heikin-Ashi turns bullish while RSI is rising from a neutral area, the move may have better momentum support. If Heikin-Ashi turns bullish while RSI is already overextended, traders may need to be more careful. The move may continue, but the risk of a pullback can be higher.
Source: Trading view
Reliability, limitations, and platform setup
Heikin-Ashi is reliable for smoothing trends, but it is not reliable as a standalone trading signal.
That distinction matters. The candles can show trend rhythm, momentum, and possible weakness. But they cannot tell the full story by themselves.
The biggest limitation is that Heikin-Ashi hides some raw price details. Because the candles are averaged, traders may not see the exact open and close in the same way they would on a Japanese candlestick chart. This can matter for entries, stops, and short-term execution.
Another limitation is lag. Since Heikin-Ashi smooths price, it may confirm a reversal after the market has already started turning. That is normal for any smoothing method.
Common mistakes and risk management
The most common mistake is treating every Heikin-Ashi colour change as a trading signal.
A candle changing from bearish to bullish does not automatically mean a strong uptrend has started. It may only mean the market is pausing or correcting. The same applies when candles change from bullish to bearish.
Another mistake is ignoring real price. Since Heikin-Ashi candles are smoothed, traders should be careful when placing stops and entries from the candle body alone. It is often better to check normal candlesticks or actual price levels before execution.
Risk management still matters. Traders should use stop losses, avoid oversized positions, and understand where the trade idea is invalidated.
Is the Heikin-Ashi indicator reliable?
Heikin-Ashi is reliable when used for the right purpose.
It is useful for showing smoother trends, reducing visual noise, and helping traders stay with momentum. It can be especially helpful in trending markets, where normal candlesticks may look messy during small pullbacks.
But it is less reliable in ranging markets. When price has no clear direction, Heikin-Ashi can produce mixed candles, frequent colour changes, and weak signals. So the better answer is this: Heikin-Ashi is reliable as a trend-reading tool, but not as a complete strategy.
How to add Heikin-Ashi on MT5 and trading view
Heikin-Ashi is available on most major trading platforms, including MT5 and TradingView.
On trading view, traders can usually add Heikin-Ashi by opening the chart type menu and selecting Heikin-Ashi instead of regular candles. This changes the candle display and shows smoothed price action.
On MT5, Heikin-Ashi is often available as a built-in custom indicator or can be added from the indicators list.
FAQs
What is Heikin-Ashi?
Heikin-Ashi is a candlestick charting method that smooths price action using an average-based formula. It helps traders see trend direction, momentum, and possible weakness more clearly than normal candles. It is useful for trend reading, but it does not always show the exact real-time open and close like Japanese candlesticks.
What does Heikin-Ashi mean?
Heikin-Ashi means “average bar” in Japanese. The name reflects how the candles are built. Instead of using only raw open, high, low, and close prices, Heikin-Ashi uses averaged values from current and previous candles. This smoothing is what makes trends look cleaner and easier to follow.
How is Heikin-Ashi calculated?
Heikin-Ashi is calculated using modified open, high, low, and close values. The close is usually the average of the current open, high, low, and close. The open is based on the previous Heikin-Ashi open and close. This formula smooths price action, but it can also create some lag during fast reversals.
Is Heikin-Ashi better than candlesticks?
Heikin-Ashi is not always better than candlesticks. It is better for smoothing trends and reducing chart noise. Japanese candlesticks are better for reading exact price levels, entries, exits, and classic candle patterns. Many traders use both: Heikin-Ashi for trend direction and normal candlesticks for precise execution.
How do you read Heikin-Ashi candles?
You read Heikin-Ashi candles by looking at colour, body size, and wicks. Strong bullish trends often show bullish candles with large bodies and little or no lower wick. Strong bearish trends often show bearish candles with large bodies and little or no upper wick. Small bodies with both wicks usually suggest hesitation or consolidation.
What is the best Heikin-Ashi strategy?
A common Heikin-Ashi strategy is to combine it with a moving average. Traders may look for bullish Heikin-Ashi candles above a rising moving average or bearish candles below a falling moving average. This helps filter weak signals. The strategy works better when supported by trend structure, risk management, and confirmation from momentum or volume.


