Support
 How is VIX calculated? a clear guide to the fear index
The Volatility Index (VIX) measures the 30-day implied volatility derived from options linked to the S&P 500 using a model-free methodology developed by the CBOE. Used as a barometer of market sentiment, it usually maintains an inverse relationship with the S&P 500.
The VIX index measures the 30-day implied volatility of the S&P 500, commonly rising during bearish phases and decreasing during optimistic periods.
Its calculation methodology weights short-term and subsequent out-of-the-money (OTM) option prices to calculate an expected variance of constant maturity.
The VIX tends to move in the opposite direction of the US stock market, serving as a key tool for hedging risk.
As it is not a directly tradable index, investors trade through linked products such as ETFs or CFDs.
What is the VIX Volatility Index?
The Volatility Index (VIX) measures the 30-day implied volatility derived from options linked to the S&P 500 stock index. This index is widely used as an indicator of market sentiment, as it rises when selling pressure increases due to growing pessimistic or bearish sentiment, and falls when investors trade within an optimistic or bullish market environment. For this reason, the VIX index is commonly known as the "fear index".
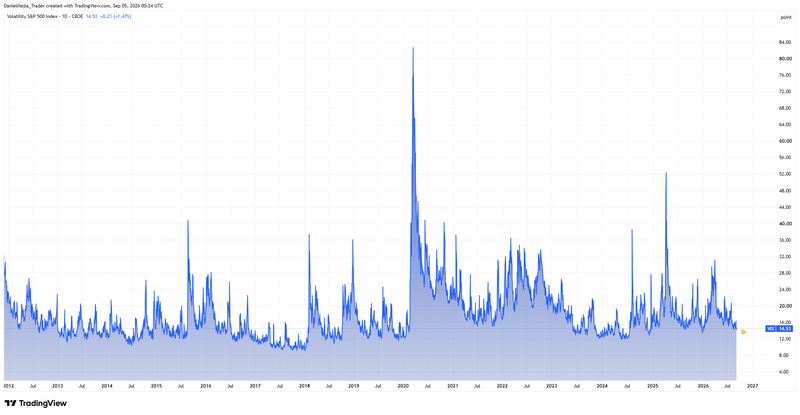
Figure 1. VIX Index (2012–2026). Source: Data from the CBOE Exchange; Figure obtained from TradingView.
Historical foundations
The VIX index was originally introduced in 1993 by the Chicago Board Options Exchange (CBOE) as a measure of market expectations regarding future volatility. Its initial methodology was based on option prices on the S&P 100 index and was frameworked within the Black–Scholes–Merton valuation model.
Subsequently, in 2003, the CBOE substantially modified its methodology to utilise options on the S&P 500 to obtain a measure of expected 30-day variance. Unlike the original methodology, the current VIX employs a so-called model-free approach; it does not require assuming a specific dynamic for volatility, but rather infers the implied variance from the prices of a broad selection of put and call options on the S&P 500.
How is the VIX Index interpreted?
The value of the VIX is expressed in percentage points. The higher its level, the greater the volatility expected by the market. In contrast, a lower VIX value indicates lower expected volatility among investors. For example, a value of 20 represents an implied annualised standard deviation of approximately 20%, which is associated with a 30-day time horizon.
Methodology for calculating the VIX Index
The CBOE outlines the calculation methodology of its algorithm through the following sequence:
- Constituent Option Series Selection: The algorithm selects which groups of option series to use, categorising them into near-term options and next-term options. This ensures a controlled average expiry time is maintained to avoid liquidity distortions or pricing anomalies.
- Risk-Free Interest Rate Calculation: To value options accurately and discount future cash flows, the model requires a precise risk-free rate matching the days remaining until the expiration of the chosen options. To achieve this, the algorithm applies a mathematical smoothing method to interpolate or extrapolate the appropriate rate for the specific days to maturity.
- Determination of the Implied Forward Price (F) and the Strike Base (Ko): Prior to weighting the options, the calculation must determine the central level of the market (the at-the-money point) and the implied forward price of the underlying asset, both derived from the options market. These variables are fundamental to calculating implied volatility.
- Constituent Strike Selection: The algorithm captures market implied volatility by using exclusively out-of-the-money (OTM) options, as they are highly liquid and better reflect price change expectations. The selection of strikes for the analysed options must satisfy this criterion.
- Calculation of Single-Term Volatility: With the options selected and filtered for each of the two expiries, the expected variance for each term is calculated independently. All individual contributions are subsequently aggregated, and a correction term is applied based on the difference between the forward price and the strike base.
- Interpolation for Constant Maturity Volatility: To yield a constant-term volatility index, the algorithm performs a time-weighted linear interpolation between the near-term variance and the next-term variance. This calculation uses the exact number of minutes to each maturity relative to the target term. Finally, the square root of the interpolated average variance is extracted and multiplied by 100 to produce the index point level, which is disseminated in real time by the CBOE.
For further details regarding the mathematical calculation, consult the document Cboe Volatility Index Mathematics Methodology published by the Chicago Board Options Exchange.
Importance of the VIX Index and its correlation with the S&P 500
The VIX index is extensively utilised to analyse market sentiment across US equity markets. When the VIX begins to rise, reflecting higher expected volatility, investors can identify periods when markets are likely to experience heightened selling pressure, which is typically mirrored in declines in the S&P 500 index. This enables market participants to execute risk-minimising strategies across their positions or implement portfolio hedging.
Additionally, the VIX index generally maintains an inverse relationship with the S&P 500 index. That is, when the VIX rises, the SPX tends to fall. Conversely, when the VIX declines, the SPX tends to sustain bullish behaviour. Correctly interpreting the volatility index allows investors and traders to identify potential buying or selling opportunities.
Limitations of the VIX Index
The VIX index, like most financial market indicators, is not deterministic. The inverse relationship with the S&P 500 does not hold true in every instance, as both indices can occasionally move in the same direction. Rather than predicting exact outcomes, the VIX index describes the volatility expectations of market participants for future periods. If investors anticipate market contractions, they begin purchasing put options to hedge risk; this implied expectation serves to infer probable future market behaviour.
Furthermore, it is important to note that the VIX is not itself an investable asset. Investors cannot trade directly on the volatility index. Those seeking to take an underlying exposure could use financial or speculative instruments linked to its performance, such as exchange-traded funds (ETFs) or contracts for difference (CFDs), which aim to replicate its underlying trend.
Conclusion
The VIX Index is an essential pillar of modern financial analysis, providing a clear window into US stock market volatility expectations. Its rigorous, model-free algorithmic calculation offers an objective metric of perceived short-term risk. While neither a direct investment instrument nor a completely deterministic indicator, an understanding of VIX dynamics remains critical for investors and traders seeking to develop effective hedging strategies and anticipate potential shifts in market sentiment.
If you're interested in trading indices, foreign exchange, shares, or commodities, consider exploring the CFD contracts offered by Equiti Group. Please note that trading leveraged derivatives involves a high level of risk and may not be suitable for all investors.
FAQs
What is the VIX index and why is it known as the "fear index"?
The VIX measures the 30-day implied volatility derived from options on the S&P 500 index. It is popularly known as the "fear index" because it tends to rise during periods of uncertainty or heightened selling pressure, reflecting growing pessimistic sentiment and an increased demand for hedging among investors. Conversely, when an optimistic or bullish environment prevails, expected volatility decreases and the index tends to decline.
How has the VIX calculation methodology evolved since its creation?
Introduced in 1993 by the CBOE, the VIX originally measured options on the S&P 100 using the Black–Scholes–Merton framework. In 2003, the methodology was updated to incorporate options on the S&P 500 using a model-free approach. This method does not assume a fixed dynamic for volatility, but instead infers expected variance from the prices of a broad selection of short-term, out-of-the-money put and call options.
What is the relationship between the VIX and the S&P 500 index?
Historically, the VIX and the S&P 500 maintain an inverse correlation: when the VIX rises, the S&P 500 typically falls, whereas a declining VIX usually coincides with bullish market behaviour. However, this relationship is not deterministic, and specific risk dynamics can occasionally cause both indices to move in the same direction.
Is it possible to trade directly in the VIX index?
No, the VIX is a mathematical calculation rather than a directly tradable asset. However, market participants wishing to take positions or speculate on implied volatility can do so via derivative instruments and exchange-traded products linked to its performance, such as exchange-traded funds (ETFs) or contracts for difference (CFDs).