Support

How pivot points work in technical analysis
Pivot points are technical indicators used to identify potential support and resistance levels in financial markets. By analysing previous price movements, traders can use these levels to assess market direction and identify possible trading opportunities.
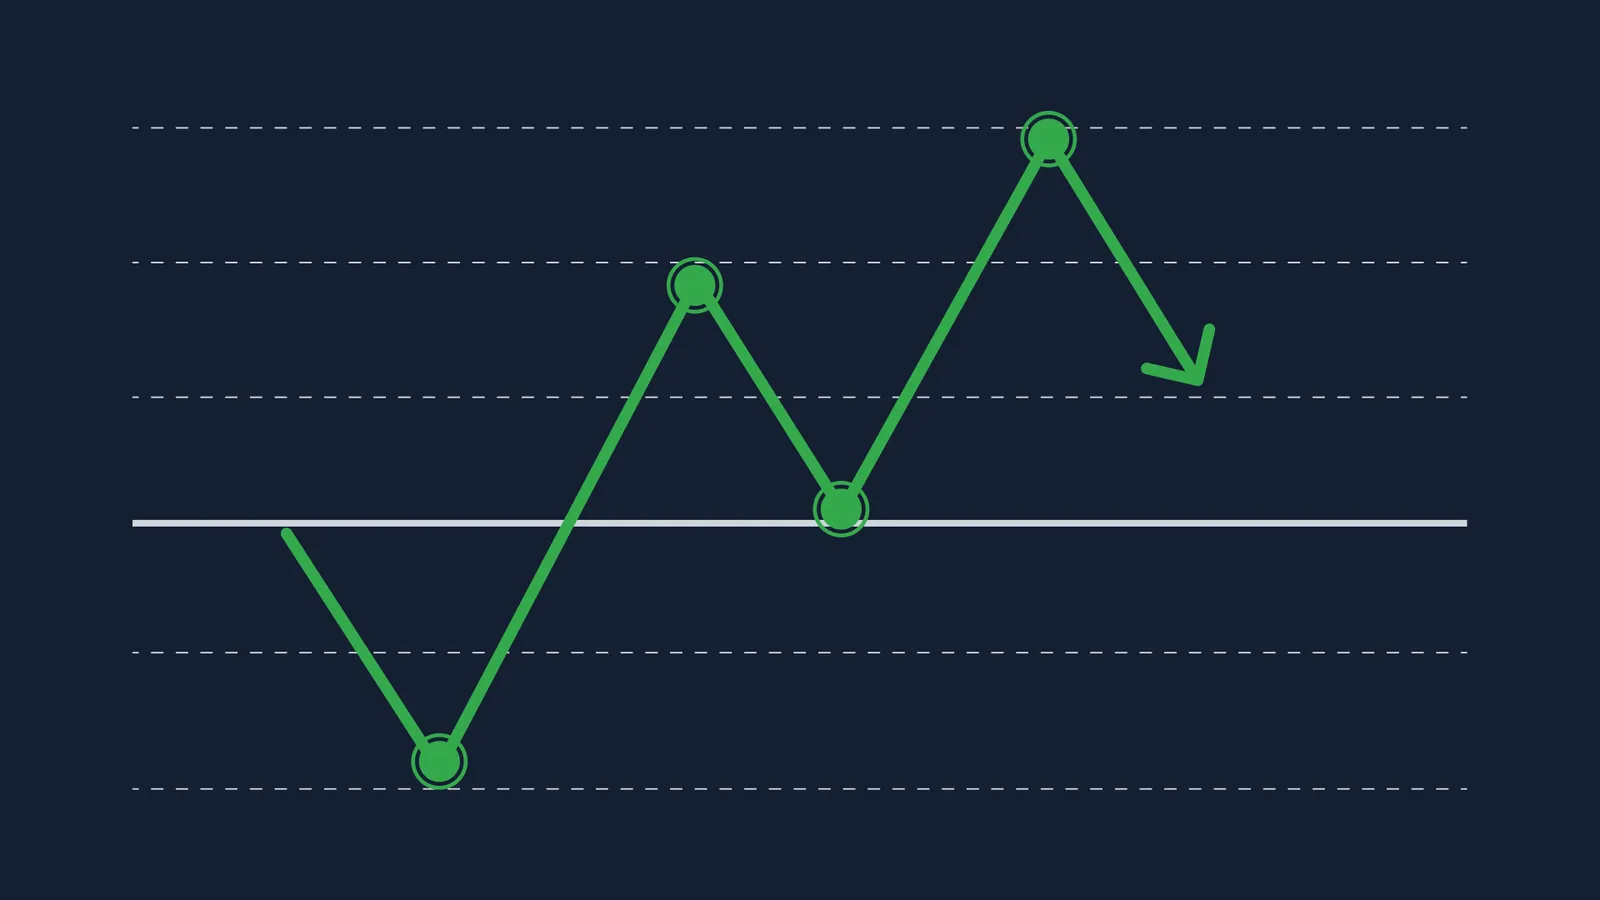
Pivot point trading uses historical price data to calculate potential support and resistance levels.
The central pivot point helps traders assess market direction and sentiment.
Resistance levels (R1, R2, R3) and support levels (S1, S2, S3) highlight areas where prices may react.
Pivot points can help traders identify potential breakouts and reversals.
Standard pivot points are widely used, although alternative calculation methods are available.
What is pivot point trading?
Pivot point trading is a technical analysis method built around the idea that markets tend to react at predefined price levels. These levels are calculated before a trading session begins and can help traders identify where price may stall, reverse or accelerate.
Rather than responding to every price movement in isolation, traders can use pivot points as a roadmap for the session. The central pivot provides a reference for overall market direction, while the support and resistance levels above and below it highlight areas where buying or selling pressure could increase.
Pivot points do not predict exactly where the market will move. Instead, they provide reference areas that traders can assess alongside price action, market conditions and other forms of technical analysis.
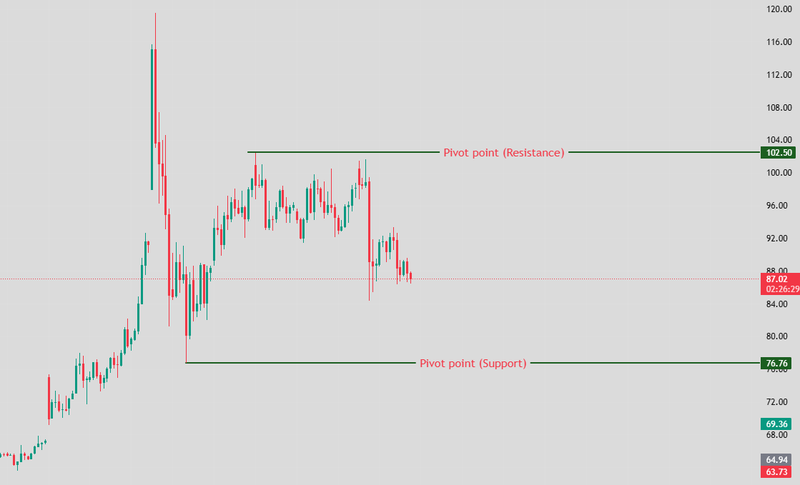
Source: Trading View
Pivot point formula: how to calculate support and resistance levels
Pivot points are calculated using price data from the previous trading period, most commonly its high, low and closing prices.
The central pivot point represents the average of these three values:
Pivot Point (PP) = (High + Low + Close) / 3
From the central pivot, additional resistance and support levels can be calculated. These create a structured set of price levels above and below the pivot.
Intraday traders commonly use levels calculated from the previous day, while swing traders may use weekly pivots and longer-term traders may refer to monthly levels.
Standard pivot point formulas
Standard, or ‘floor’, pivot points use the previous period’s high, low and close to calculate the following levels:
- Pivot Point (PP) = (High + Low + Close) / 3
- R1 = (2 × PP) − Low
- S1 = (2 × PP) − High
- R2 = PP + (High − Low)
- S2 = PP − (High − Low)
- R3 = High + 2 × (PP − Low)
- S3 = Low − 2 × (High − PP)
These levels normally remain fixed throughout the trading session. When the next period begins, they are recalculated using the latest high, low and close.
Pivot point calculation example
Suppose the previous day's prices for a currency pair were:
High: 1.1050
Low: 1.0950
Close: 1.1000
The central pivot would be:
PP = (1.1050 + 1.0950 + 1.1000) / 3 = 1.1000
The previous day's range is 0.0100. Using the standard formulas:
R1 = 1.1050
S1 = 1.0950
R2 = 1.1100
S2 = 1.0900
If price begins the next session above 1.1000, traders may interpret this as a bullish bias and monitor R1 and R2 as potential resistance levels or profit targets.
If price falls below 1.1000 and remains there, the bias may become bearish, with S1 and S2 becoming the next areas to monitor.
The levels themselves do not provide an entry signal. Traders typically look at how price behaves when it reaches them before making a trading decision.
Which session close should you use for pivot points?
The data used to calculate pivot points can affect where the levels appear on a chart, so it is important to use a consistent trading session and data source.
For exchange-traded stocks and indices, pivot points are usually calculated using the official high, low and close from the previous trading session.
Forex and CFD markets can be more complicated because daily candles may differ depending on a broker's server time. Many traders use charts based on a 5pm New York close when calculating daily forex pivot points, but the most important factor is consistency.
Markets that trade around the clock may not have a universal closing price. In these cases, traders should use the same data source and session definition consistently rather than switching between different charts.
Shortened trading sessions, holidays and periods of low liquidity can also produce unusual levels. Traders may choose to compare daily levels with weekly pivots or adjust their approach when the previous session was not representative of normal trading conditions.
Understanding the central pivot as market bias
The central pivot point can act as a reference for overall market direction.
When price trades above the central pivot, traders may interpret this as a bullish intraday bias. Trading below it may suggest a bearish bias. However, the central pivot alone does not confirm market direction, particularly when price repeatedly crosses the level in range-bound or volatile conditions.
This distinction can help traders filter potential setups. For example, a trader may favour long opportunities while price remains above the central pivot and short opportunities while it remains below.
However, this should not be treated as a fixed rule. Price can repeatedly cross the central pivot in range-bound or volatile conditions, so the broader trend and price action should also be considered.
What R1, R2, R3, S1, S2 and S3 mean in pivot trading
The complete set of pivot levels creates a structure around the central pivot.
R1, R2 and R3 sit above the central pivot and identify potential resistance areas. S1, S2 and S3 sit below it and identify potential support areas.
R1 and S1 are the first resistance and support levels beyond the central pivot. R2, R3, S2 and S3 sit progressively farther away and may become relevant during larger price movements. Whether the market reaches these levels depends on volatility and the strength of the prevailing move.
These levels can act as barriers, targets or breakout zones rather than exact prices where the market must reverse. If price breaks through R1, for example, traders may begin watching R2 as the next potential resistance area.
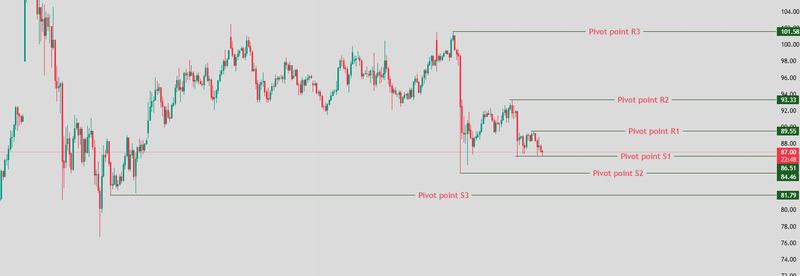
Source: Trading View
How to read pivot points on a trading chart
Reading pivot points involves looking at both the position of price relative to the central pivot and how price behaves when it reaches individual levels.
A test occurs when price approaches a pivot level. Traders then watch to see whether the market moves through it or reacts away from it.
A rejection happens when price reaches or briefly moves through a level before reversing. This can suggest that the level is acting as support or resistance, particularly when accompanied by clear price action.
A breakout occurs when price moves decisively through a pivot level. Traders may look for a candle close beyond the level, increased momentum or other confirmation before treating the move as a genuine breakout.
A retest can happen after a breakout, when price returns to the level it has just crossed. Previous resistance may then act as support, or previous support may become resistance.
These reactions can provide more information than the pivot level alone. Instead of assuming price will automatically reverse at R1 or S1, traders can wait to see how the market responds.
How to trade with pivot points step by step
The first step is choosing pivot levels that match the intended trading timeframe. Daily pivots are commonly used for intraday trading, while weekly pivots may provide more useful context for swing trades. Monthly pivots can help identify broader market levels.
Before entering a trade, mark the central pivot together with the relevant support and resistance levels. Check whether price is above or below the central pivot and use this as an initial indication of market bias.
Next, assess the market environment. If price is moving sideways between established levels, a reversal approach may be more appropriate. If the market is trending strongly, traders may instead look for breakouts through pivot levels.
Wait for price to interact with a relevant level rather than entering simply because it is nearby. A rejection, breakout, retest, candlestick pattern or change in momentum can provide additional confirmation.
Before entering, define where the trade idea becomes invalid. A stop-loss can then be placed beyond that point rather than directly on the pivot level. The next pivot level can provide a potential profit target.
Finally, compare the potential return with the amount being risked. If the next pivot level is too close to provide an appropriate reward relative to the stop-loss, the setup may not justify a trade.
Pivot point trading strategies: reversals and breakouts
Pivot points are commonly used in two main ways: looking for price to reverse from a level or looking for price to break through it and continue towards the next level.
Pivot point bounce strategy
A pivot point bounce strategy looks for price to approach support or resistance and then move away from it.
For example, if price approaches S1 and begins showing signs of rejection, a trader may look for a potential move back towards the central pivot. Similarly, rejection from R1 could indicate a possible move lower.
Rather than entering as soon as price touches the level, traders may wait for confirmation such as a rejection candle, a failed attempt to break the level or a change in short-term momentum.
A stop-loss may be positioned beyond the level or another point that would invalidate the setup, while the central pivot or next pivot level can provide a potential target.
Bounce strategies tend to be more suited to range-bound or lower-volatility conditions, where price is moving between established support and resistance areas.
Pivot point breakout strategy
A breakout strategy assumes that price will move through a pivot level and continue in the same direction.
For example, a strong move above R1 could put R2 in focus as the next potential resistance level. A break below S1 could similarly bring S2 into view.
Some traders wait for price to close beyond the level rather than entering on the initial move. Others may wait for price to return and retest the broken level. If R1 is broken and subsequently holds as support, for example, this may provide additional confirmation of the breakout.
Volume, momentum and candle closes can also help assess the strength of a move. However, false breakouts remain possible, particularly around periods of high volatility or major economic announcements.
Risk management around pivot levels
Pivot points can help structure risk management because they provide predefined areas for planning entries, exits and invalidation levels.
When entering near a pivot level, traders may place a stop-loss beyond the level or price structure that would invalidate the trade. Stops should not automatically be placed directly on a pivot, as price can briefly move beyond a level before reversing.
Pivot levels can also provide potential profit targets. A trader entering near the central pivot, for example, might use R1 or S1 as an initial target depending on the direction of the trade. Further levels can then be used to manage or scale out of a position if momentum continues.
Risk should still be considered independently of the pivot levels. A setup may appear technically attractive but offer insufficient potential return relative to the amount at risk.
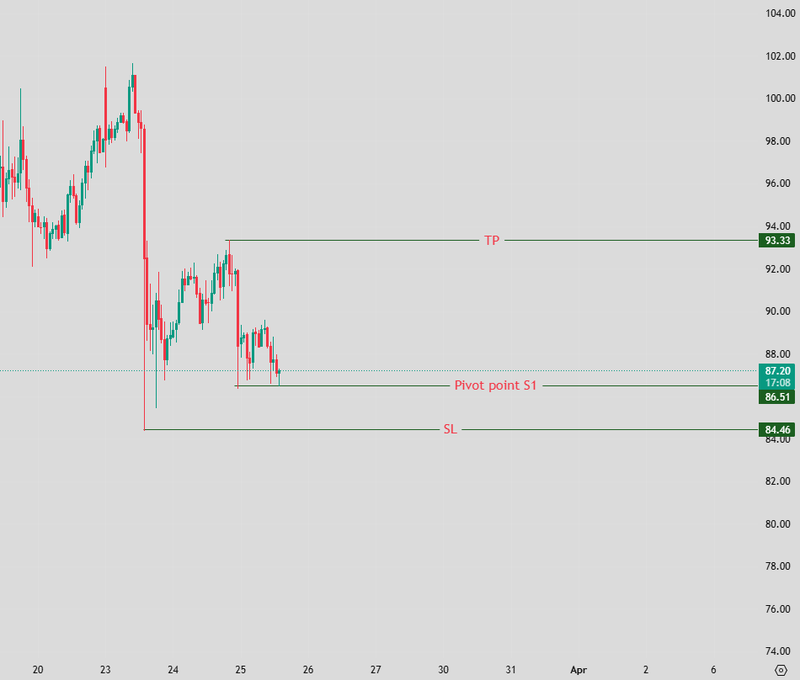
Source: Trading View
Limitations of pivot points and common mistakes
Pivot points are reference levels rather than predictions. There is no guarantee that price will stop or reverse when it reaches a pivot.
Strong trends can move through several levels in one session, while major economic releases, central bank decisions or company earnings can trigger sharp movements, false breakouts and slippage.
One common mistake is buying whenever price reaches support or selling whenever it reaches resistance without considering the broader market. Trend direction, volatility and price confirmation can all affect whether a level is likely to hold.
Another mistake is placing stop-loss orders directly on obvious pivot levels. Price may briefly move through a level before reversing, so traders should consider where the underlying trade idea would actually become invalid.
The timeframe also matters. Daily pivots may be useful for intraday trading but can create unnecessary noise for longer-term positions. Swing traders may find weekly or monthly levels more relevant.
Finally, traders should avoid trying to trade every pivot level. A level becoming available does not mean a high-quality setup exists.
Combining pivot points with other technical indicators
Pivot points can be combined with other forms of technical analysis to provide additional context.
For example, a pivot support level that also aligns with a moving average, trendline or previous area of support may attract more attention than a pivot level appearing in isolation.
Momentum indicators such as RSI or MACD can also be used to assess whether momentum supports a potential reversal or breakout. Candlestick patterns around a pivot may provide further information about how buyers and sellers are responding to the level.
However, adding more indicators does not automatically produce better signals. Too many tools can create conflicting information, so traders generally focus on a small number of indicators that serve different purposes.
Different types of pivot points
Standard or ‘floor’ pivot points are the most widely used, but several variations calculate their levels differently.
Fibonacci pivot points incorporate Fibonacci ratios when calculating support and resistance levels and may appeal to traders who already use Fibonacci analysis.
Woodie’s pivot points place greater emphasis on the closing price, giving recent price action more weight in the calculation.
Camarilla pivot points create a series of relatively close support and resistance levels and are often associated with short-term or mean-reversion strategies.
DeMark pivot points use different calculations depending on the relationship between the previous period's opening and closing prices.
The appropriate method depends on the trader's strategy, timeframe and market. Standard pivots are often the simplest starting point because they are widely recognised and straightforward to calculate.
FAQs
How do you calculate R1, R2, R3 and S1, S2, S3 from the central pivot point?
Using standard pivot points, R1 and S1 are calculated from twice the central pivot minus the previous low or high. R2 and S2 use the previous period’s range, while R3 and S3 extend these calculations further. All levels are based on the previous period’s high, low and close.
Which previous session or time zone should traders use for daily pivot points in forex, indices and crypto markets?
For exchange-traded indices, traders typically use the official previous session. Forex traders may use daily candles based on a 5pm New York close, while crypto has no universal market close. The key is to use the same data source and session consistently.
How can traders confirm whether a move through a pivot level is a real breakout or a false breakout?
Traders may look for confirmation such as a candle closing beyond the pivot level, increased momentum or volume, or a successful retest of the broken level. No method can guarantee that a breakout will continue, so risk management remains important.
Should pivot points be used alone or combined with other indicators?
Pivot points can be used independently, but combining them with other technical analysis tools can provide additional context. Moving averages, RSI, volume and candlestick patterns may help traders assess trend direction, momentum and price behaviour around a pivot level.
What should traders do when price opens above R1 or below S1 before the trading session begins?
An opening beyond R1 or S1 can indicate strong momentum or increased volatility. Rather than assuming price will immediately reverse, traders can monitor whether the level holds as new support or resistance and look towards the next pivot level for additional context.
What are the most common mistakes beginners make when trading with pivot points?
Common mistakes include treating pivot levels as guaranteed reversal points, trading every level, ignoring the broader trend and entering without confirmation. Traders should also consider volatility, major market events and whether the potential reward justifies the risk.