Support
 SMT divergence explained: how ICT traders use correlated markets
SMT Divergence is one of the most popular concepts in ICT because it compares two correlated markets instead of analyzing one chart in isolation. The idea is simple: when two markets that normally move together stop confirming each other, the difference can reveal where liquidity is being taken and where a reversal may be developing.
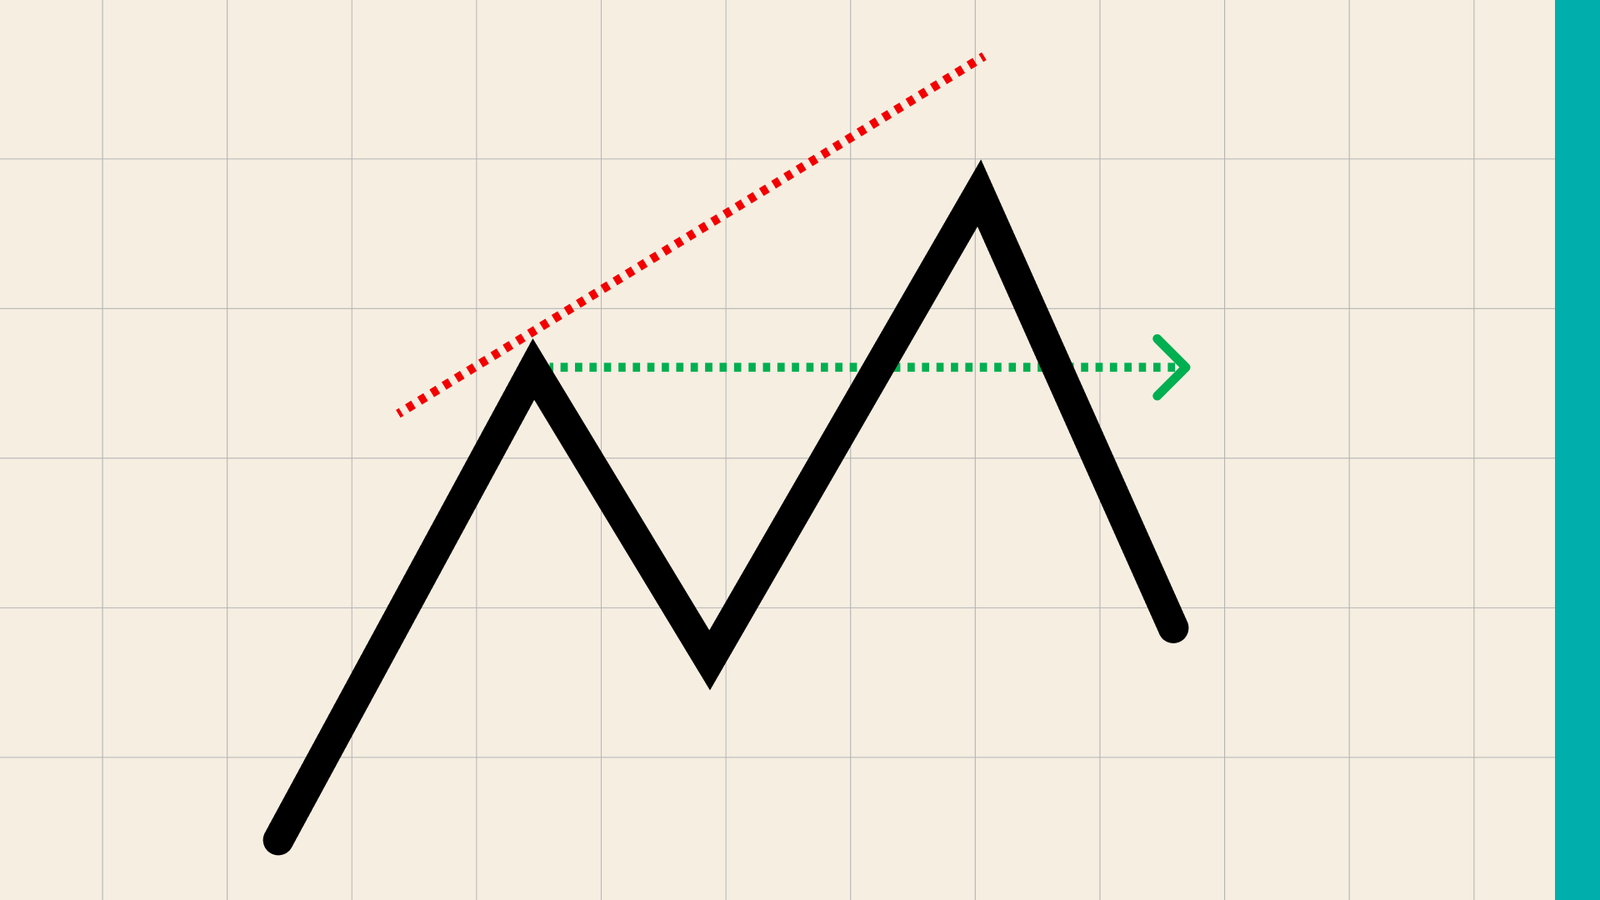
SMT stands for Smart Money Technique Divergence.
It compares two correlated markets rather than one chart alone.
The strongest setups often appear after a liquidity sweep.
SMT works best alongside market structure and displacement.
It is a confirmation tool, not a standalone entry signal.
What is SMT Divergence?
SMT Divergence happens when two correlated assets stop making matching highs or lows. For example, imagine two stock indices usually rise together. One index makes a new high, but the other fails to do so. Instead of seeing strength, ICT traders see a possible imbalance. One market may have swept liquidity while the other refused to confirm the move.
The same idea applies to forex pairs and other correlated markets. EUR/USD and GBP/USD often move in similar directions because both contain the U.S. dollar. If one pair makes a new low while the other holds above its previous low, traders begin watching for a possible reversal.
How SMT Divergence works
The process usually begins with two markets approaching an important swing high or swing low. One market sweeps the previous high or low, taking liquidity. The second market either fails to reach that level or rejects before breaking it.
That disagreement creates divergence
At that stage, traders are still waiting for confirmation. A liquidity sweep alone is not enough. The stronger setups usually show displacement, a break of structure, or a Change of Character after the divergence appears.
Source: Trading view
Types of SMT Divergence
Not every SMT setup looks the same. The strongest ones usually fall into bullish or bearish divergence depending on where liquidity is taken.
Bullish SMT Divergence
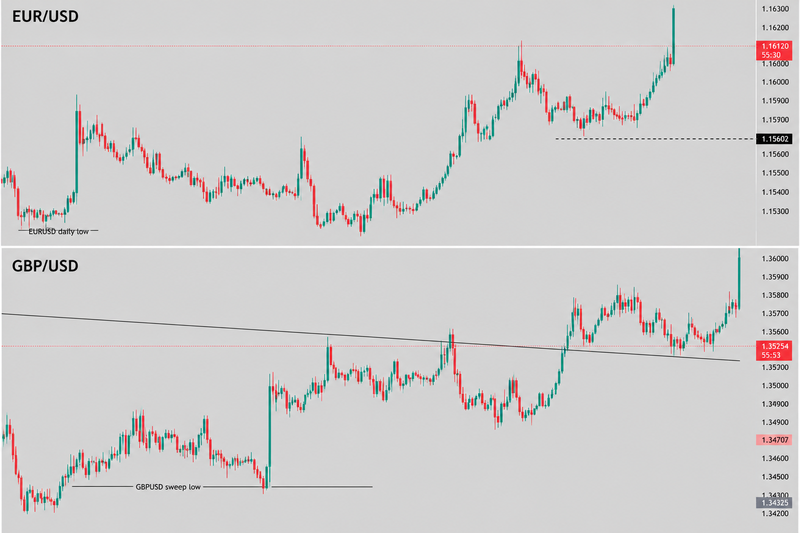
A bullish SMT appears when one market makes a lower low while the correlated market refuses to make one.
Imagine EUR/USD drops below yesterday's low and takes sell-side liquidity. At the same time, GBP/USD holds above its previous low instead of following lower.
That difference can suggest that selling pressure is weakening. If displacement and a market structure shift appear afterward, traders begin looking for long opportunities.
Source: Trading view
Bearish SMT Divergence
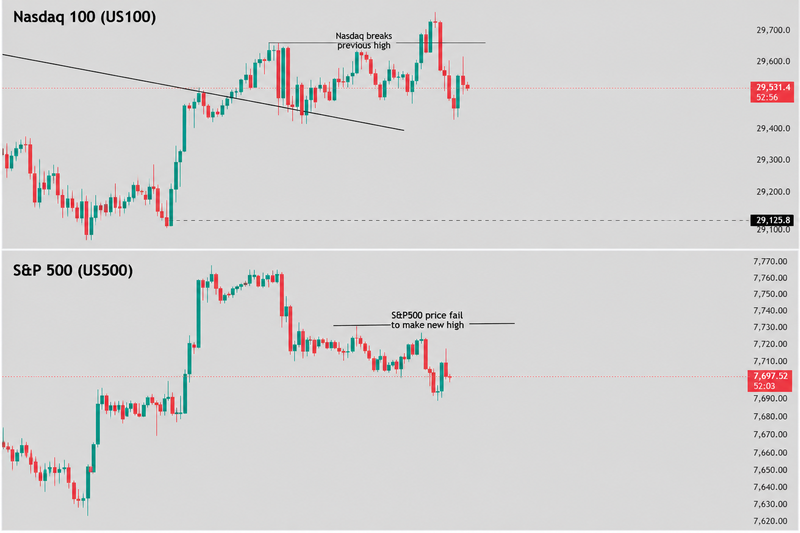
A bearish SMT works the opposite way. One market push above a previous high, taking buy-side liquidity, while the correlated market fails to make a new high. That lack of confirmation can suggest buyers are becoming trapped before a reversal develops.
Source: Trading view
Liquidity Sweep SMT
One of the highest-quality SMT setups happens when divergence appears during a liquidity sweep. Instead of treating every divergence as meaningful, ICT traders often look for one market to complete a clear stop run first.
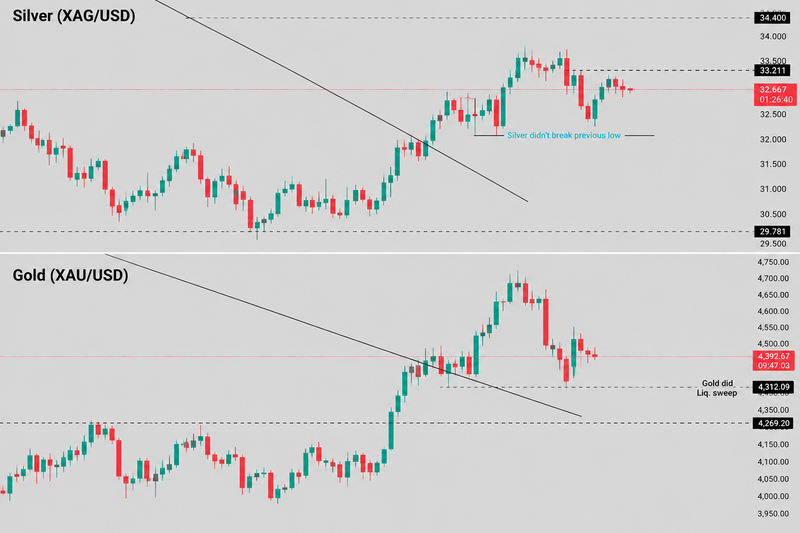
Imagine Nasdaq and the S&P 500 both approach previous highs. Nasdaq breaks above the old high, triggering breakout buyers and stop-losses from short sellers. The S&P 500, however, never confirms the breakout.
That creates a stronger bearish SMT because one market has already collected liquidity while the other refuses to validate the move.
The same logic applies in forex. If EUR/USD sweeps equal lows while GBP/USD holds above its own lows, the divergence becomes much more interesting once bullish displacement follows.
Source: Trading view
Types of correlated markets
SMT Divergence works best when comparing markets that normally share similar economic drivers. These relationships are called correlated markets, meaning the assets tend to move together or in some cases move in opposite directions because they respond to the same macro forces, liquidity conditions, or investor sentiment.
Positive correlated markets
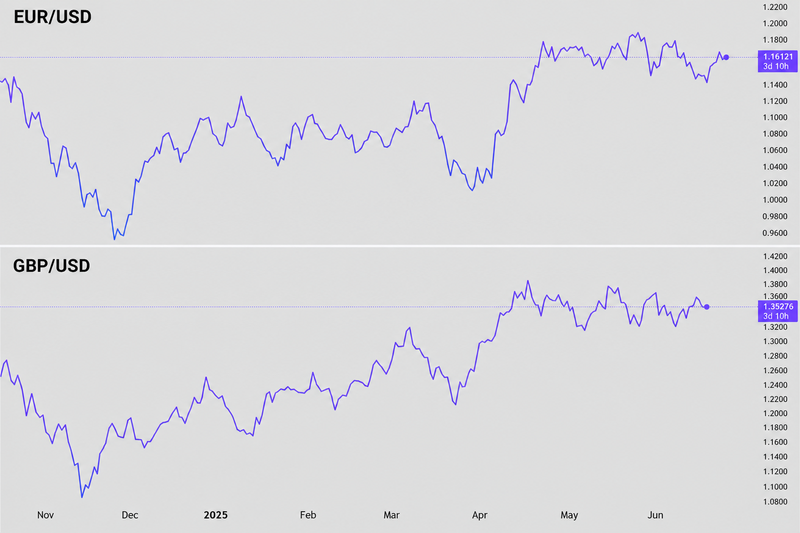
EUR/USD and GBP/USD are one of the most common SMT pairs because both contain the U.S. dollar. When the dollar weakens, both pairs often rise together. If one pair makes a new high while the other fails to confirm it, traders may look for SMT Divergence.
Source: Trading view
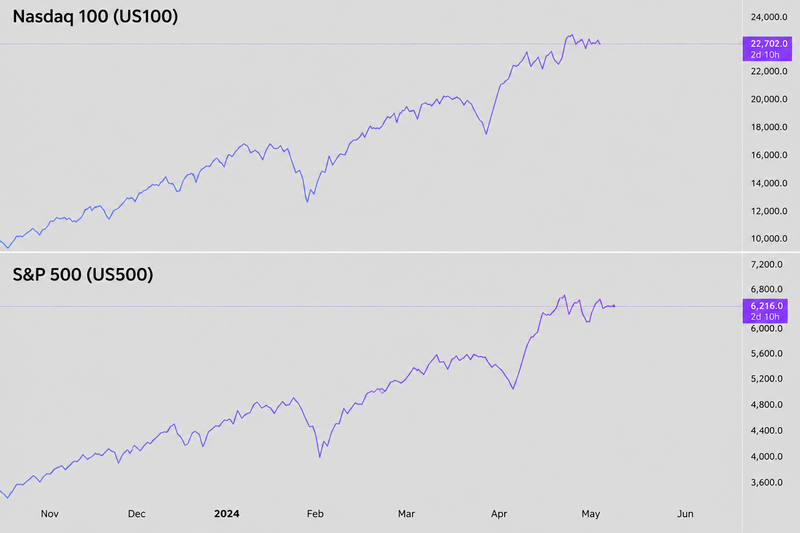
Nasdaq and the S&P 500
Tend to move together because both reflect the broader U.S. stock market. However, the Nasdaq is more heavily influenced by technology stocks, which makes it useful for spotting divergence during liquidity sweeps.
Source: Trading view
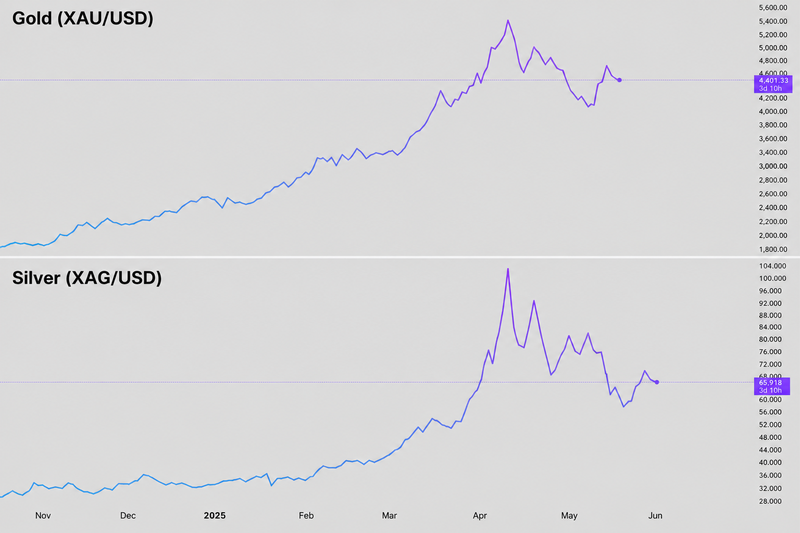
Gold and silver
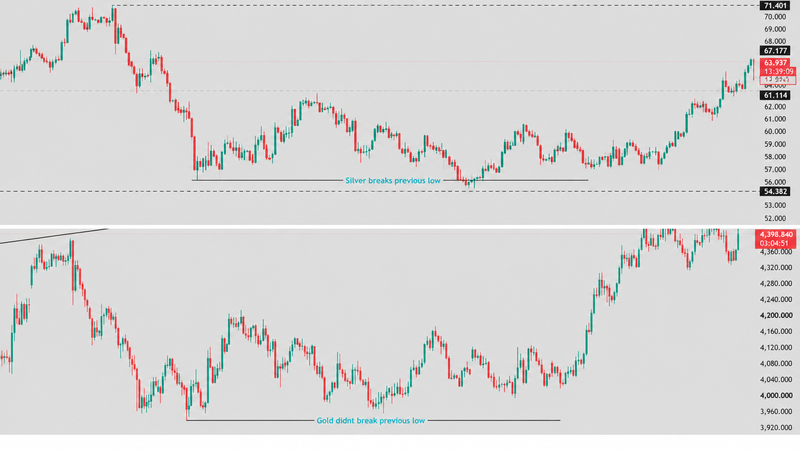
Share a positive relationship because both are precious metals that respond to inflation expectations, real yields, and risk sentiment. One metal sweeping a previous high while the other fails to confirm can become a useful SMT signal.
Source: Trading view
Negative correlated markets
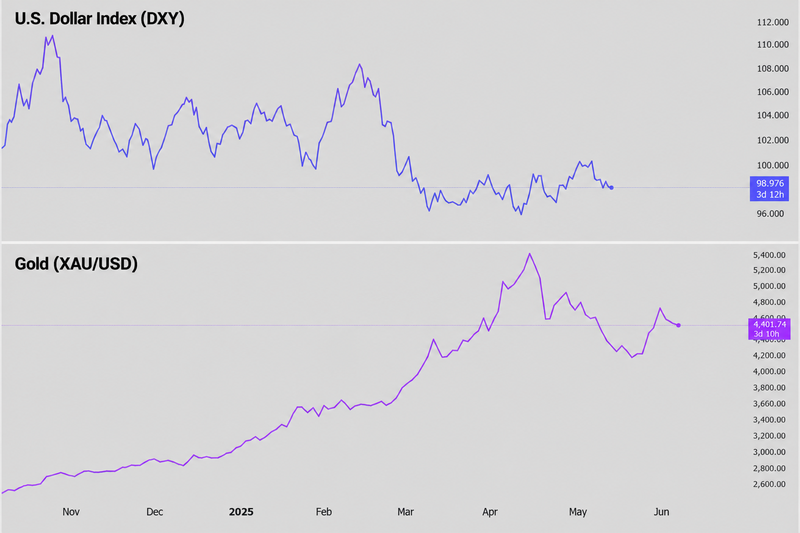
Gold and the U.S. dollar frequently show an inverse relationship. A stronger dollar can pressure gold, while a weaker dollar often supports it. Although this pair is less commonly used for classic SMT because they move opposite rather than together, understanding the relationship helps traders read broader market conditions.
Source: Trading view
How to trade the SMT strategy
The stronger approach starts with the higher-timeframe trend. If the broader direction already supports the trade, SMT becomes an additional layer of confirmation rather than the entire reason for entering.
The next step is identifying two correlated markets. Forex traders often compare EUR/USD with GBP/USD, while index traders may compare Nasdaq with the S&P 500.
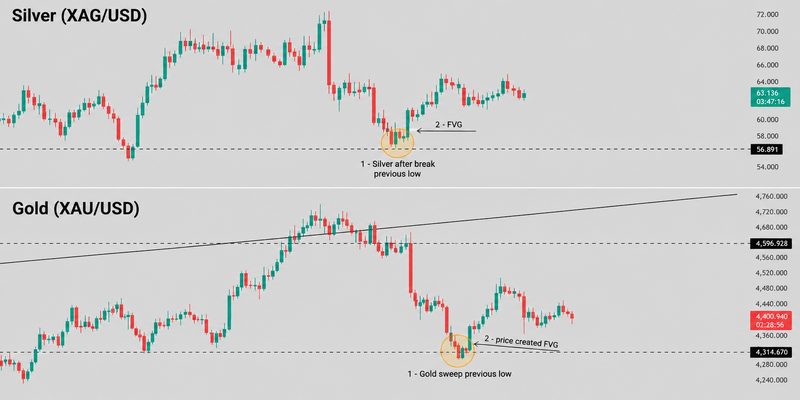
Once both markets approach an important liquidity level, traders watch for one market to sweep the high or low while the other refuses to confirm.
The actual entry usually comes after displacement
For a bullish setup, price may sweep a low, show SMT divergence, break a lower-timeframe swing high, and then retrace into a Fair Value Gap or Order Block before continuing higher.
For a bearish setup, the sequence often begins with a sweep of highs, followed by bearish SMT, displacement lower, and a retracement into an institutional zone before continuation.
Source: Trading view
What timeframe does SMT work best on?
SMT can appear on almost any chart, but its reliability usually improves as the timeframe increases. Daily and four-hour SMT setups often carry more weight because they involve larger liquidity pools and broader institutional participation.
Intraday traders frequently build their bias from the one-hour or four-hour chart before looking for execution on the five-minute or fifteen-minute chart during London or New York sessions. Very small timeframes can produce many SMT signals, but they also create much more noise.
Risks of trading SMT Divergence
The biggest risk is assuming every divergence leads to a reversal. Correlated markets can temporarily disagree while both continue trending in the same direction.
Another common mistake is ignoring market structure. A divergence without displacement or a break of structure often provides weak confirmation.
Correlation itself can also change. Markets that normally move together may temporarily decouple because of asset-specific news, economic releases, or changes in investor positioning.
News events create another challenge. During major announcements, one market may react faster than another, producing temporary SMT signals that disappear once volatility settles.
Finally, traders should avoid forcing SMT onto unrelated assets. The concept works best when comparing markets that have a genuine historical relationship rather than simply looking for random differences between two charts.
FAQs
What does SMT stand for in ICT?
SMT stands for Smart Money Technique. It describes divergence between two correlated markets that may reveal a liquidity event before a reversal.
What is SMT Divergence in trading?
SMT Divergence happens when one correlated market makes a new high or low while the other fails to confirm that move, creating a potential clue about shifting order flow.
Which markets work best for SMT?
Popular combinations include EUR/USD and GBP/USD, Nasdaq and the S&P 500, and other markets that normally share a strong correlation.
Is SMT Divergence bullish or bearish?
It can be either. A bullish SMT usually forms after one market makes a lower low while the other refuses to do so. A bearish SMT appears when one market makes a higher high that the other fails to confirm.
Does SMT always require a liquidity sweep?
The strongest ICT setups usually combine SMT with a liquidity sweep, but the sweep alone is not enough. Traders still look for displacement and a market structure shift before entering.
What timeframe is best for SMT Divergence?
Many traders use the Daily or four-hour chart for bias and the fifteen-minute or five-minute chart for execution after the divergence has been confirmed.