Support
Understanding low resistance liquidity Runs and high resistance liquidity runs
Not all price action can reach old highs and lows quickly. Some will only take a couple of candles to reach its target, while others will retrace several times. Traders will use the terms Low Resistance Liquidity Runs (LRLR) and High Resistance Liquidity Runs (HRLR) to show the differences.
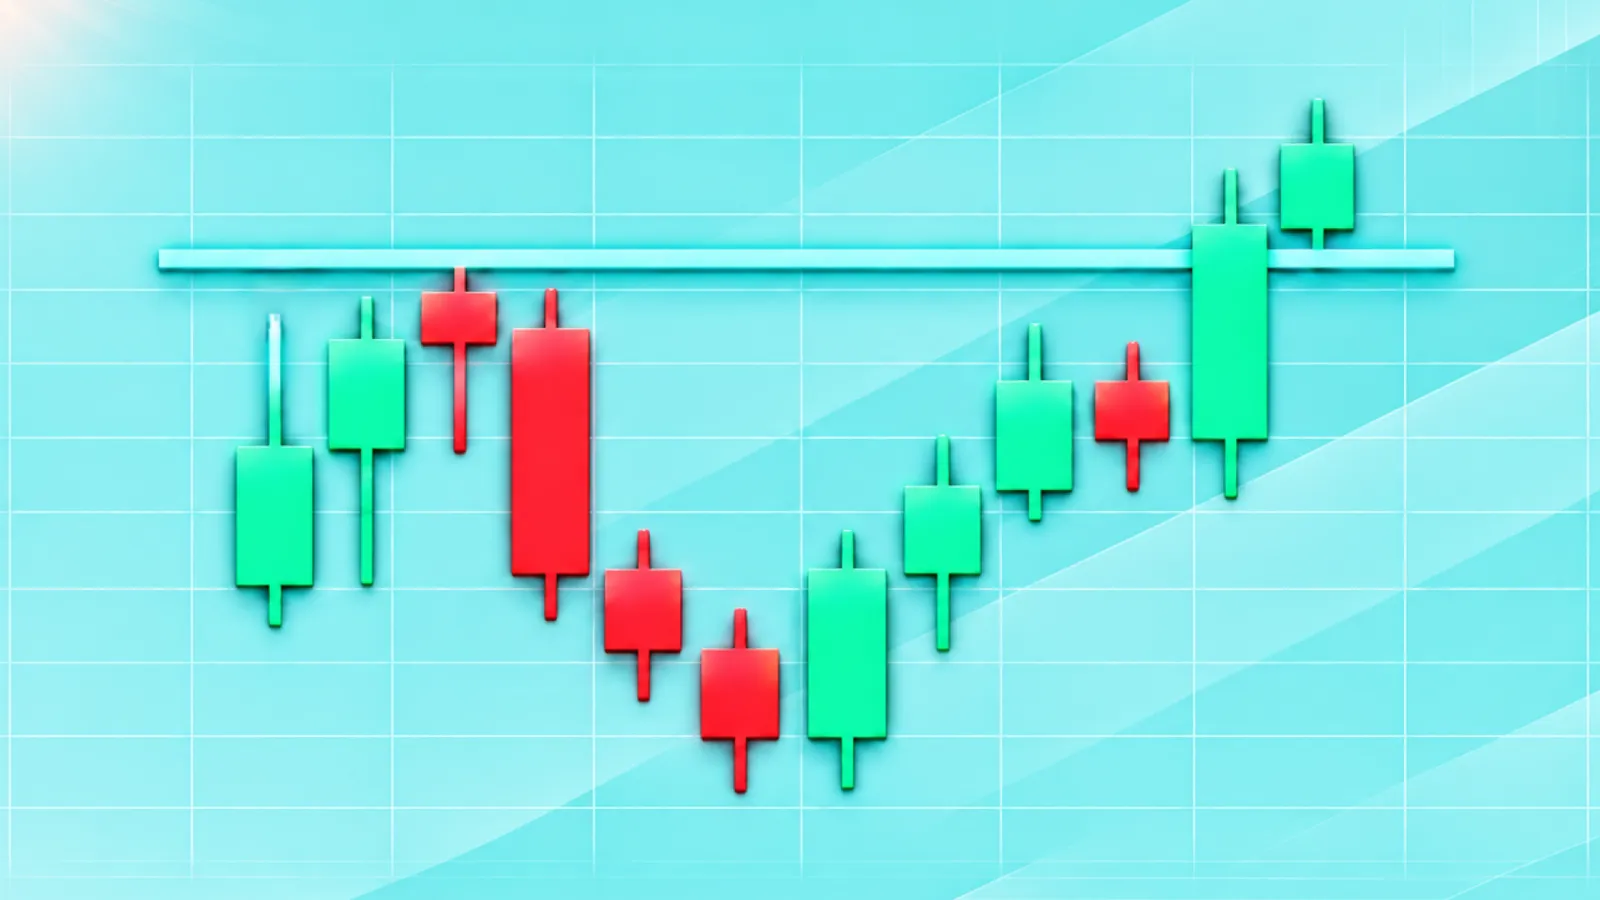
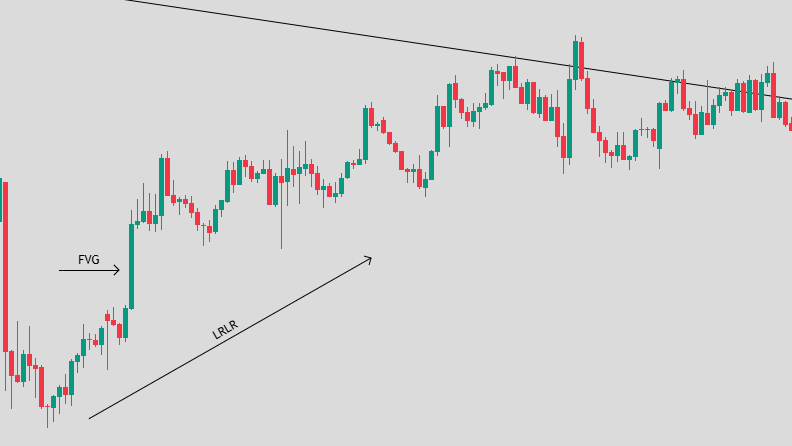
A Low Resistance Liquidity Run (LRLR) Price is trending towards liquidity with a lack of structure in the way.
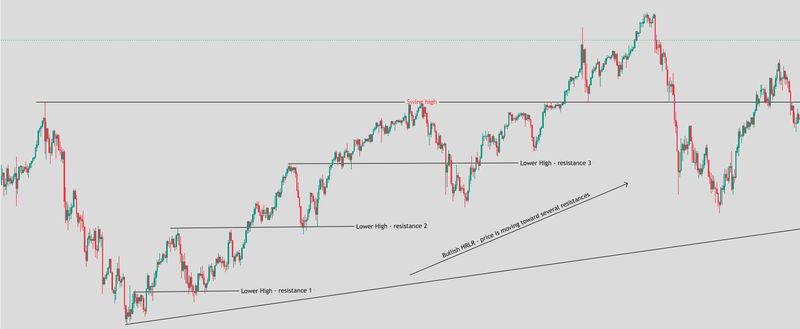
A High Resistance Liquidity Run (HRLR) Price needs to go through various swing highs/lows or opposing structures.
A failed swing, liquidity sweep and Fair Value Gaps (FVG) can be used to help identify conditions.
Traders will use LRLR and HRLR to judge what your profit targets could be, where to place your stop loss and if you have enough space for your trade.
What is liquidity?
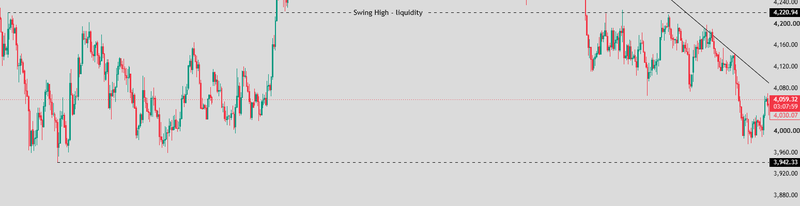
Liquidity is when there are orders in the market. Often when doing technical analysis, you will look at areas where there are lots of stop losses and pending orders.
These areas tend to be areas where you have had old swing highs and lows
There will often be areas of liquidity on the buy side above old highs. This is due to traders who are short may have their stop losses here. There may also be buy stops from breakout traders.
There will often be areas of liquidity on the sell side below old lows
Long traders may have placed their stop losses here, as well as sell stops from traders looking for a breakdown.
For example, if EUR/USD has struggled to break above 1.1000 several times you may expect there to be lots of buy orders above this level.
Once price breaks through this level it may trigger some of these orders, creating more activity around the breakout.
Old highs and lows are popular areas to look at as they show where there could be lots of orders, however we cannot see how much liquidity there is from the candle.
Source: Trading view
What is a low resistance liquidity run (LRLR)?
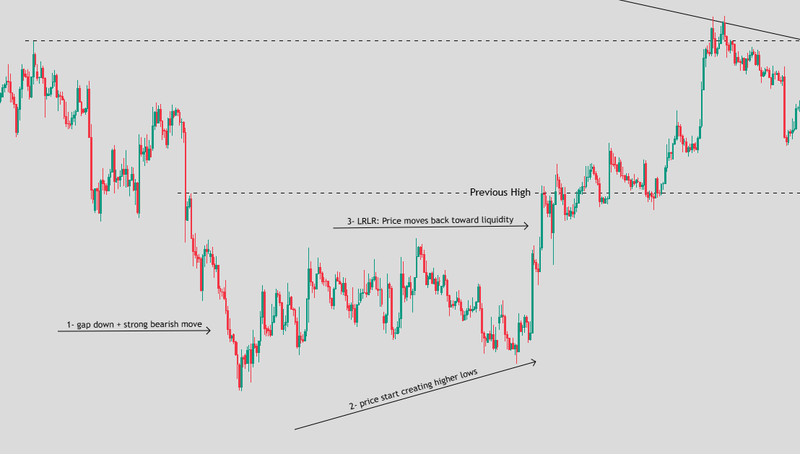
A low resistance liquidity run shows that price is trending towards liquidity with little resistance from opposing structures.
The way from price to target will be clean, therefore price can easily move through. For example, if EUR/USD has gapped down from 1.1000 to 1.0900 with several big bearish candles and little retracement.
If buyers start taking control again price may easily move back through this range as there aren’t many solid swing highs between the current price and 1.1000.
Traders would call this a potential bullish LRLR
The same can apply to bearish scenarios. If price has moved up through an area with little retracement, then it may face less resistance when it comes to breaking below.
LRLR’s are often known for having strong momentum, big candles and shallow retracements. However, just because the way is clean doesn’t mean price will reach the liquidity.
Source: Trading view
What is a high resistance liquidity run (HRLR)?
A high resistance liquidity run means that there are several layers of previous structure to get through before reaching its target.
Price is not going directly towards its old high/low and will instead face smaller swing points, consolidation and other levels where traders may react.
Say EUR/USD is trading at 1.0900 with an old high at 1.1000
The market has created several lower highs at 1.0920, 1.0950 and 1.0980. Buyers will need to move through these levels before getting to the larger liquidity above 1.1000. Price may face selling pressure at each of these levels causing price to stall/pullback.
Source: Trading view
Identifying LRLR and HRLR
The main difference between LRLR and HRLR is how much structure there is in the way of price reaching its liquidity.
Start by finding a significant old high/low and seeing how price has moved away from it.
Failed swings and liquidity sweeps
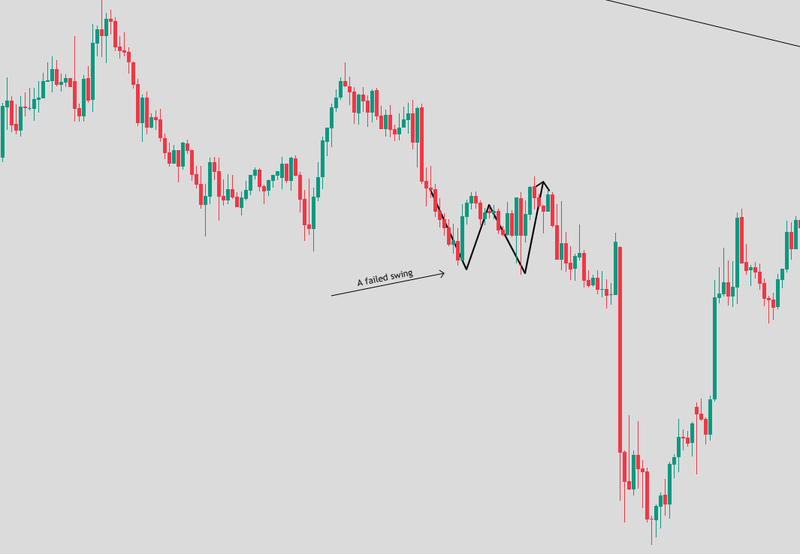
A failed swing is when price tries to continue in one direction but fails to break through previous swing points.
For example, EUR/USD reaches 1.1000 but then pulls back. Price then rallies but only manages to get to 1.0980 before falling again.
The second high has failed to break through the first high. If price then falls through an area with little resistance, then traders may see a potential bearish LRLR.
A liquidity sweep is when price breaks through a level but then falls back below. Say EUR/USD breaks above 1.1000 and goes to 1.1015 before falling back below.
Source: Trading view
Price has gone through the buy liquidity but then reversed
If price, then falls through several solid swing lows then this can be seen as a bearish HRLR.
This can give useful context to the situation, but it doesn’t guarantee it will be an LRLR or HRLR. A failed swing can come before an HRLR, and a liquidity sweep can lead to an LRLR. It depends on the structure in the way of price reaching your target.
Candlestick patterns and Fair Value Gaps
LRLR’s often happen when price is moving strongly. This will cause consecutive candles to move in one direction with little retracement.
Large bodies can show strong buying/selling momentum. This may also create Fair Value Gaps (FVG). These are areas of imbalance that occur over 3 candles, where the wicks of the first and third candles do not overlap. For example, if price gaps up strongly there may be a bullish FVG.
HRLR’s tend to look very different
Price may create several small candles with multiple tops and bottoms. There may also be consolidation and deeper retracements. There may also be previous FVG’s, order blocks and swing points in the way.
However, just because there is an FVG doesn’t mean it will be an LRLR. You will still need to look at the structure.
Source: Trading view
How traders use LRLR and HRLR
Understanding the difference can help traders to know which levels of liquidity are reasonable targets and where you may face issues.
Take Profit Targets
Traders often look for old highs/lows as profit targets. If there is a clean way for price to reach a liquidity, then this could be a good target to use. Especially if you have a confirmed entry.
For example, if price is trading at 24,100 with an old high at 24,250 and there are no significant swing highs in between then a long trader may want to take profit at this level.
However, you also need to consider how far away the target is, how volatile the market is and how the market is behaving. Just because there isn’t much resistance doesn’t mean you will quickly and reliably reach your target.
Stop Loss
HRLR’s will have multiple swing points which can be useful for placing your stop loss.
For example, if you short you may place your stop above a recent swing high which would invalidate your bearish scenario.
Having a solid swing point in a high resistance area can give you a good reference point as price has reacted here before.
However, this isn’t guaranteed to hold. If you place your stop too close to an obvious high/low, then it could be hit during normal market movement or liquidity sweeps.
Don’t enter trades in choppy markets
A common mistake is to enter a breakout without checking what is in the way of your entry and next target.
If price breaks above a short-term resistance at 1.0950. However, there are several old swing highs between 1.0960 and 1.1000. Although this seems bullish, price may struggle to get through the remaining levels.
Risks of trading liquidity runs
LRLR and HRLR are ways of viewing the structure and shouldn’t be viewed as a strategy on their own.
Just because there is a clean way for price to move doesn’t mean it will be a successful trade. Especially during economic announcements or low liquidity.
You also need to consider what time frame you are looking at. Something that looks clean on a 5-minute chart may have several levels of resistance on a 1-minute chart. Something that looks clean on a 5-minute chart may look unimportant on a 4-hour chart.
Liquidity is also an estimate. We cannot know exactly how many stop losses are sitting above/below a certain level.
Assuming an HRLR will stop price reaching its target can be risky. Momentum can be strong and news can come through causing price to break through several levels of resistance quickly.
Therefore, you should use liquidity runs along with structure, confirmation, position sizing and pre-set risk.
FAQs
What is the difference between an LRLR and HRLR?
An LRLR shows price is moving towards liquidity with a clean path and little resistance. An HRLR shows there are multiple swing points or resistance in the way.
How can I identify an LRLR?
Look for a clean path towards an old high/low. If price is moving strongly with little retracement and little resistance, then it could be an LRLR.
Can a liquidity sweep create an LRLR?
Yes. A liquidity sweep can create both an LRLR and HRLR. It depends on the structure in the way of price reaching the next liquidity.
Are Fair Value Gaps important when trading LRLR?
FVG’s often occur during strong price movements. They can help traders to see the momentum and where price may react. However, just because there is an FVG doesn’t mean it will be an LRLR.
Is an LRLR more profitable than an HRLR?
Not necessarily. While there may be a cleaner path to your target, it depends on how much you paid for your entry, where you placed your stop loss, volatility and risk management.
Can swing points from HRLR be used for stop loss?
Yes. Having relevant swing highs/lows can help you to see where your idea may become invalid. However, they can still be broken especially during volatile conditions.