Parabolic SAR explained: what it is and how traders use it
Parabolic SAR is a technical indicator used to identify trend direction, possible reversals, and trailing stop levels. It appears on the chart as dots above or below price, which makes it one of the easier indicators to recognize. But easy to recognize does not mean easy to use well.

Parabolic SAR stands for “Stop and Reverse.”
It was developed by J. Welles Wilder Jr., who also created indicators such as RSI and ATR.
The indicator places dots below price in an uptrend and above price in a downtrend.
Definition and purpose
Parabolic SAR is a trend-following indicator designed to show where a trend may continue and where it may be losing strength.
The word “SAR” stands for “Stop and Reverse.” That explains the original idea behind the indicator. It was built to help traders decide where a position might be stopped out and where the market may be ready to move in the opposite direction.
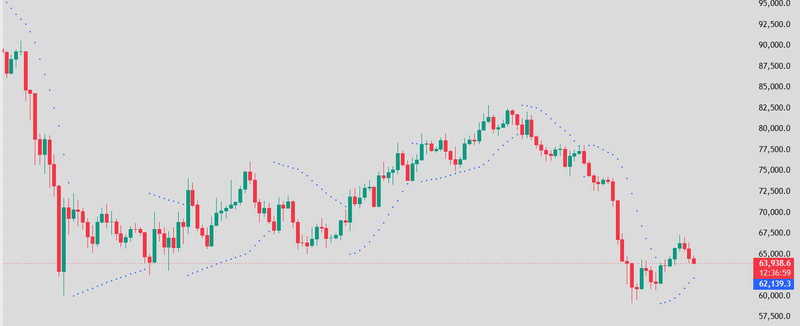
On a chart, Parabolic SAR appears as a series of dots. When the dots are below price, the indicator points to an upward trend. When the dots are above price, it points to a downward trend. This makes it visually simple, which is one reason many traders use it.
The real value of the indicator is not that it predicts the future. It does not. Its value is that it gives traders a structured way to follow price and manage risk while a trend is developing.
Source: Trading view
What Parabolic SAR Measures
Parabolic SAR measures trend direction and the level where that trend may be considered broken.
It does not measure volume, earnings, valuation, economic strength, or sentiment. It is based on price movement. The indicator follows the market as price moves higher or lower, then adjusts its dots as the trend develops.
In an uptrend, the dots move below price and gradually rise as price pushes higher. In a downtrend, the dots move above price and gradually fall as price moves lower. This is why traders often use it as a trailing stop tool.
When The Indicator Works Best
Parabolic SAR works best when the market is trending clearly.
That means price is making steady higher highs and higher lows in an uptrend, or lower highs and lower lows in a downtrend. In this environment, the dots can stay on one side of price for a long time, helping traders stay with the move instead of exiting too early.
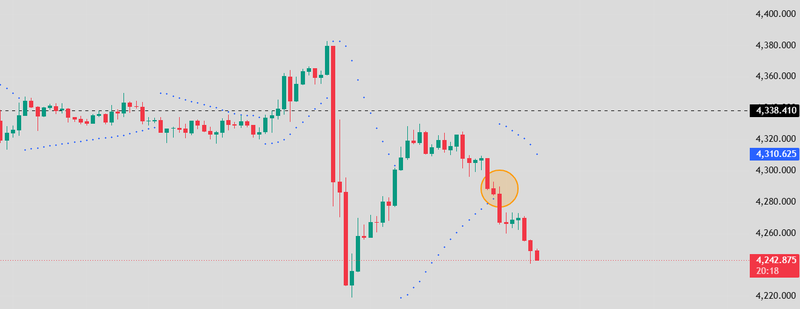
The problem starts when price becomes choppy. If the market moves sideways, the dots can flip above and below price too often. That can create false reversal signals and make the chart look more useful than it really is.
History and background
Parabolic SAR was created as part of a wider group of technical tools designed to help traders read trend, volatility, and market direction.
Its creator, J. Welles Wilder Jr., had a major influence on modern technical analysis. Many of his indicators are still used today because they deal with practical trading questions: is the market trending, how strong is the move, how volatile is price, and where might a trader manage risk?
Origin and creator
Parabolic SAR was developed by J. Welles Wilder Jr.
Wilder is also known for creating the Relative Strength Index, Average True Range, and Directional Movement Index. These indicators are widely used across forex, commodities, indices, stocks, and crypto markets.
His work often focused on discipline. Instead of relying only on emotion or opinion, he built tools that gave traders clear rules. Parabolic SAR follows that idea by giving a visible level where the current trend may no longer be valid.
Why is it called stop and reverse?
It is called “Stop and Reverse” because the indicator was designed to show when one trend may have ended and the opposite direction may be starting.
In the original idea, when price crosses the SAR level, the trader would stop the current position and reverse into the opposite direction. For example, if a trader was long and price fell through the SAR level, the long trade would be closed and a short trade could be considered.
Source: Trading view
Construction and calculation
Parabolic SAR is built around a formula that moves the indicator closer to price as a trend develops.
The indicator uses three main pieces: the previous SAR value, the extreme point, and the acceleration factor. Together, these decide where the next SAR dot will appear on the chart.
The logic is simple. The SAR level starts away from price. As the trend continues, the dots move closer. If price keeps trending, the indicator follows. If price reverses enough to cross the SAR level, the indicator flips to the other side.
That is why the dots often form a curved shape on the chart. The movement is not flat. It accelerates as the trend builds.
Core formula and logic
The basic formula moves the SAR level toward the trend’s extreme point.
The simplified formula is:
SAR today + acceleration factor × (extreme point − SAR today) = SAR tomorrow
The extreme point is the highest high in an uptrend or the lowest low in a downtrend. The acceleration factor controls how quickly the SAR moves toward that extreme point.
This formula explains the behaviour of the indicator. In a strong uptrend, new highs push the SAR dots higher. In a strong downtrend, new lows push the SAR dots lower.
Acceleration factor and extreme point
The acceleration factor controls speed, while the extreme point marks the strongest price level in the current trend.
In an uptrend, the extreme point is the highest price reached during that trend. In a downtrend, it is the lowest price reached during that trend. Each time price makes a new extreme, the acceleration factor can increase.
This makes the indicator more sensitive as the trend continues. That can help traders lock in more of the move over time. But it also creates a tradeoff. If the indicator becomes too sensitive, it may flip during a normal pullback rather than a real reversal.
How trend reversals are determined
If the dots are below price during an uptrend and price falls through the SAR level, the indicator flips above price. That suggests the uptrend may have ended. If the dots are above price during a downtrend and price rises through the SAR level, the dots flip below price.
Source: Trading view
Inputs and settings
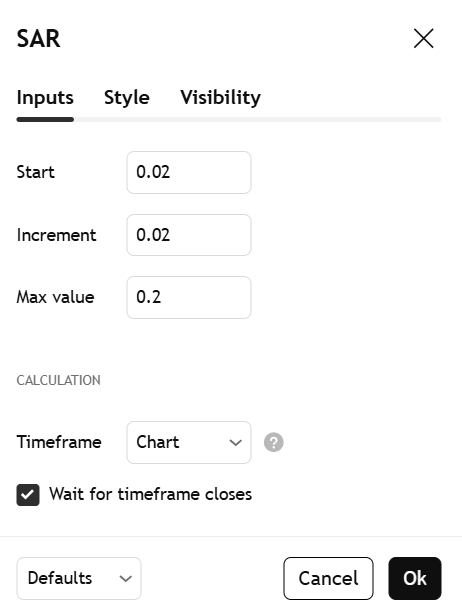
Parabolic SAR has three main inputs: start value, increment or step, and maximum value.
These settings control how quickly the dots react to price. A sensitive setting makes the indicator move closer to price faster. A slower setting gives the trend more room before a reversal signal appears.
The default settings used by many charting platforms are often 0.02 for the start or step and 0.20 for the maximum. These values are common, but they are not perfect for every asset or timeframe.
A short-term forex trader may want different settings from a longer-term stock trader. A volatile market may need wider settings than a calm market. The purpose is not to find a magic number. It is to match the indicator’s behaviour to the market being traded.
Source: Trading view
Start value
The start value is the initial acceleration factor when a new trend begins.
A common start value is 0.02. This means the indicator begins slowly and gives the new trend space to develop. If the start value is too high, the dots may move too close to price too quickly. That can cause early exits.
If the start value is too low, the indicator may react too slowly when the market changes direction. For many traders, the default value is a reasonable starting point, but it should still be tested against the asset and timeframe being traded.
Increment or step
The increment, also called the step, controls how much the acceleration factor increases when price makes a new extreme.
A common step value is 0.02. In an uptrend, when price makes a new high, the acceleration factor can increase by this step. In a downtrend, when price makes a new low, the same idea applies.
A larger step makes the indicator more aggressive. A smaller step makes it smoother. Neither is always better. A fast setting may suit active traders, but it can also create more whipsaws. A slow setting may suit trend followers, but it can react late.
Maximum value
The maximum value places a limit on how high the acceleration factor can rise.
A common maximum value is 0.20. This prevents the SAR dots from becoming too aggressive as the trend continues. Without a maximum, the indicator could move too close to price and flip too easily.
The maximum value matters because trends do not move in a straight line. Even strong trends have pullbacks. If the SAR is too tight, a normal pullback may look like a reversal. A higher maximum makes the indicator more responsive, while a lower maximum gives the trend more breathing room.
How to read parabolic SAR signals
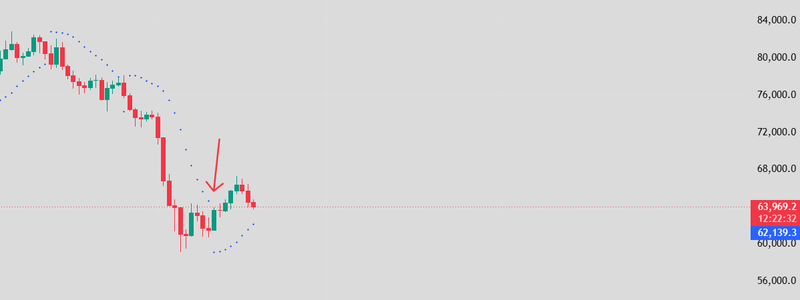
Dots below price usually point to an uptrend. Dots above price usually point to a downtrend. A switch from one side of price to the other can act as a possible reversal warning.
The clean look of the indicator is helpful, but it can also tempt traders to overreact. A dot change does not always mean the market has entered a strong new trend. Sometimes it only means price has moved enough to trigger the calculation.
The best way to read Parabolic SAR is to ask whether the market is trending, whether the signal fits the wider chart structure, and whether there is confirmation from other evidence.
Dots above or below price
Dots below price suggest bullish pressure, while dots above price suggest bearish pressure.
When the dots sit below the candles, the indicator is saying that buyers are still in control according to its rules. When the dots sit above the candles, it is saying that sellers are in control.
The distance between the dots and price also matters. If the dots are far from price, the trend may still have room. If the dots are very close to price, the trade may be more vulnerable to a reversal signal. Still, the dots should not be read in isolation.
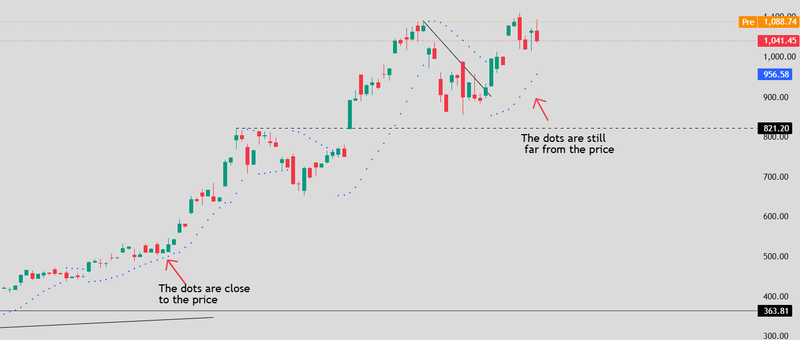
Source: Trading view
Stop placement and trailing stops
Parabolic SAR is often most useful as a trailing stop tool.
In a long trade, traders may use the SAR dots below price as a guide for moving the stop higher. This helps protect profit while still giving the trend room to continue. In a short trade, traders may use the dots above price as a guide for moving the stop lower.
This removes some emotion from trade management. Instead of guessing where to exit, the trader has a visible level that adjusts with the market. But stops should still account for spreads, volatility, and the asset being traded.
Identifying potential reversals
Parabolic SAR can help identify potential reversals when the dots flip to the opposite side of price.
A flip from below price to above price suggests that bullish momentum may be weakening. A flip from above price to below price suggests that bearish momentum may be losing control.
This can be useful, especially when the flip happens near a major support or resistance level. But a SAR flip is not proof. In choppy markets, the dots may flip several times without any meaningful trend forming. Traders should look for confirmation before treating the signal as reliable.
Performance, limitations, and practical tips
The indicator is designed for trending markets. That means it naturally performs better when prices move with direction and momentum. When the market is stuck in a range, the indicator can produce weak signals.
This is not a flaw unique to Parabolic SAR. It is the normal weakness of many trend-following tools. They help when the market trends, and they struggle when the market chops.
The important tip is simple. Do not ask Parabolic SAR to do everything. Use it for what it is good at: following trends, managing exits, and warning when momentum may be changing.
Combining with other indicators
A moving average can help define the broader trendRSI can help identify momentum and overextended conditions. ATR can help traders judge whether the stop distance makes sense compared with current volatility.
The goal is not to fill the chart with indicators. Too many tools can create confusion. The goal is to give Parabolic SAR the context it needs. A simple approach could be to use a moving average for trend direction, Parabolic SAR for trailing stops, and support and resistance to judge where signals matter most.
Source: Trading view
FAQs
What is Parabolic SAR?
Parabolic SAR is a technical indicator that helps traders identify trend direction, possible reversals, and trailing stop levels. It appears as dots above or below price on a chart. Dots below price usually suggest an uptrend, while dots above price usually suggest a downtrend. It works best when the market is trending clearly.
What does Parabolic SAR stand for?
Parabolic SAR stands for “Parabolic Stop and Reverse.” The name explains its purpose. It was designed to show where a trader might stop an existing position and where the market may be starting to reverse direction. In practice, many traders use it as a warning signal rather than automatically reversing every trade.
Who created the Parabolic SAR indicator?
Parabolic SAR was created by J. Welles Wilder Jr., a well-known technical analyst who also developed indicators such as the Relative Strength Index, Average True Range, and Directional Movement Index. His tools are still widely used because they focus on practical trading problems, including trend direction, volatility, momentum, and risk management.
How does Parabolic SAR work?
Parabolic SAR works by placing dots on the chart that follow price as a trend develops. In an uptrend, the dots appear below price and rise as the market moves higher. In a downtrend, the dots appear above price and fall as the market moves lower. If price crosses the SAR level, the indicator flips sides.
How do you read Parabolic SAR dots?
You read Parabolic SAR dots by looking at where they appear compared with price. Dots below price usually suggest bullish momentum. Dots above price usually suggest bearish momentum. When the dots switch from one side to the other, it may signal a potential reversal. The signal is stronger when it matches the broader trend.


