Support

Pin bar trading strategy: How to trade price rejection
The pin bar trading strategy uses candlestick rejection patterns to identify potential reversals and trend continuation opportunities at important price levels.

Pin bars reveal failed attempts to sustain higher or lower prices.
Bullish and bearish pin bars help identify potential turning points.
Support, resistance, and market structure determine signal quality.
Entry confirmation and stop-loss placement are essential.
What is a pin bar trading strategy?
A pin bar trading strategy is a price action method that identifies potential market reversals or trend continuation opportunities using candlesticks with long wicks and small bodies. The pattern signals price rejection, showing that buyers or sellers attempted to move the market in one direction but failed to maintain control before the candle closed.
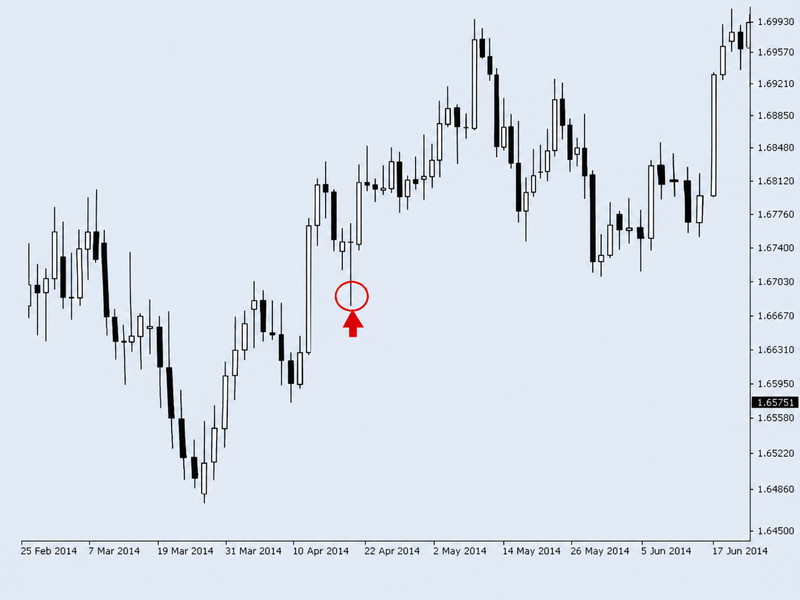
For example, when a currency pair briefly breaks below support and then closes above it, the resulting long lower wick suggests that selling pressure was absorbed or overcome by buyers. Traders may interpret this as an early indication that prices could recover.
Pin bars appear across forex, stocks, and commodities. However, their effectiveness depends heavily on location. A rejection candle forming at established support or resistance generally provides more meaningful information than an identical pattern appearing in the middle of a trading range.
How to identify a pin bar candlestick pattern
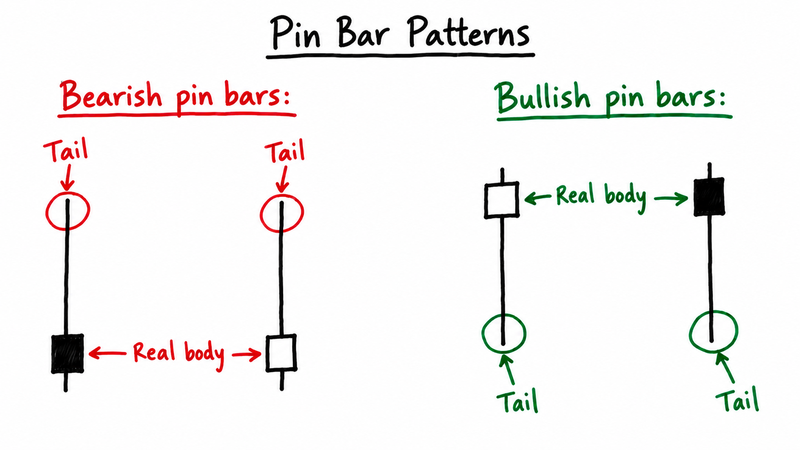
A pin bar has three defining characteristics: a long rejection wick, a small real body, and a closing price near the opposite end of the candle.
The wick represents the price movement that the market failed to sustain. Many traders prefer the dominant wick to account for at least two-thirds of the candle's total range, although this is a guideline rather than a universal rule.
The real body, which measures the difference between the opening and closing prices, should remain relatively small. The opposite wick is usually short or nearly absent.
The candle's color is less important than its structure. A bullish rejection pattern can occasionally close below its opening price while still demonstrating substantial buying pressure.
The most useful pin bars also stand out from surrounding price action, with a clearly identifiable rejection of an important technical level.
Bullish vs. bearish pin bar patterns
Bullish pin bar: Rejection of lower prices
A bullish pin bar forms when sellers push prices lower but buyers regain control, leaving a long lower wick and a small body near the candle's high.
The pattern becomes particularly relevant when it appears at support, following a temporary breakdown, or during a pullback within an established uptrend.
A bullish pin bar does not guarantee an upward reversal. Traders typically look for additional confirmation, such as a break above the candle's high or renewed bullish market structure.
Bearish pin bar: Rejection of higher prices
A bearish pin bar develops when buyers push prices higher before sellers force the market back down. It features a long upper wick and a small body near the candle's low.
These patterns are frequently monitored around resistance levels, previous swing highs, and rallies within broader downtrends.
A bearish pin bar becomes more convincing when prices fail to reclaim the rejected level and subsequently break below the candle's low.
Why support and resistance matter in pin bar trading
The location of a pin bar often determines whether the pattern deserves attention.
Consider a market approaching a resistance level that has repeatedly prevented further gains. Some traders may sell near that level, while others position buy orders above it, expecting a breakout.
If prices briefly break above resistance before reversing, the move may trigger breakout entries and stop-loss orders from short positions. A subsequent decline back below resistance creates a long upper wick, indicating that buyers failed to sustain the breakout.
This behavior is sometimes associated with a liquidity sweep, particularly when prices briefly move beyond a previous swing high or low.
However, a wick alone cannot confirm institutional trading activity or deliberate stop-loss targeting. What matters is the observable rejection and whether subsequent price action supports the potential reversal.
The same principle applies to bullish pin bars at support. A temporary breakdown followed by a recovery can signal that selling pressure is weakening, especially when the broader market trend remains positive.
How to trade a pin bar strategy step by step
A practical pin bar strategy combines trend analysis, significant price levels, entry confirmation, and predefined risk.
- Identify the market direction
Start with the broader trend on the daily or four-hour chart.
In an uptrend, traders generally favor bullish pin bars after pullbacks toward support. During downtrends, bearish pin bars forming near resistance may offer opportunities to trade with the prevailing momentum.
Moving averages, trendlines, and sequences of higher highs and higher lows can help establish market direction.
- Mark important price levels
Identify established support and resistance zones, previous daily or weekly highs and lows, and major breakout levels before looking for trading signals.
A pin bar rejecting a well-established level may carry more weight than one forming without any clear technical reference.
The strongest setups often develop where several factors overlap, such as horizontal support, a previous breakout area, and a broader uptrend.
- Wait for the candle to close
A developing pin bar can change significantly before the trading period ends.
A candle that initially shows strong rejection may eventually close near its low or high, eliminating the original signal.
Waiting for the completed candle helps distinguish a genuine rejection structure from temporary price fluctuations.
- Choose an entry method
Traders commonly use two approaches.
Breakout entry: Enter above the high of a bullish pin bar or below the low of a bearish pin bar. This requires prices to move further in the expected direction before activating the trade.
Retracement entry: Wait for prices to pull back toward the pin bar's body or midpoint. This can improve the entry price and potential reward-to-risk ratio, although the retracement may never occur.
Both methods have limitations. Breakout entries may suffer from poor pricing after large candles, while retracement entries risk missing strong moves.
- Define the stop-loss and profit target
A stop-loss is commonly positioned beyond the rejected extreme. For bullish pin bars, this means below the candle's low. For bearish pin bars, it means above the candle's high.
Profit targets should reflect nearby market structure, particularly the next significant support or resistance level.
A potential reward-to-risk ratio of 2:1 is a commonly used benchmark, but the target must be supported by realistic price levels rather than chosen arbitrarily.
What are the best timeframes for pin bar trading?
Pin bars can appear on any timeframe, but their usefulness depends on the trading strategy and market conditions.
Daily charts are commonly used by swing traders because they capture broader price movements and reduce some intraday noise.
Four-hour charts provide more frequent opportunities while retaining useful information about short-term market structure.
One-hour and fifteen-minute charts can support intraday trading, although they are more exposed to temporary volatility, false breakouts, and transaction costs.
A practical multi-timeframe approach involves marking important support and resistance on the daily chart before using the four-hour or one-hour timeframe to identify entry opportunities.
When should you avoid trading pin bars?
Not every rejection candle represents a worthwhile trading opportunity.
Pin bars forming in the middle of sideways price action often lack the structural context needed to support a directional trade. Similarly, a bullish pin bar against a powerful downtrend may signal only a temporary recovery.
Another warning sign is limited room to the next major price level. A bullish setup immediately below strong resistance may offer insufficient upside relative to the required stop-loss.
Large pin bars can also create unfavorable risk conditions. If the rejection wick is unusually long, placing a stop beyond it may require an excessive distance, while entering after confirmation could leave too little potential reward.
Major economic announcements create additional uncertainty. Federal Reserve decisions, inflation data, and Non-Farm Payrolls can trigger sharp price swings and apparent rejection patterns that fail within minutes.
Traders should evaluate the broader price structure before treating any pin bar as a meaningful signal.
Pin bar vs. hammer and shooting star
Pin bars share similar characteristics with traditional candlestick patterns, particularly the hammer and shooting star.
A hammer features a long lower wick and typically appears after a decline, suggesting that selling pressure may be weakening.
A shooting star has a long upper wick and usually forms after an advance, indicating possible rejection of higher prices.
Pin bar terminology focuses more broadly on the rejection structure and its location. The same candle shape may represent a reversal after an extended move or continuation following a temporary pullback.
Is the pin bar trading strategy profitable?
The pin bar trading strategy can form part of a profitable trading system, but the pattern alone does not establish a reliable statistical advantage.
Performance depends on trend direction, market volatility, the quality of support and resistance levels, entry timing, and risk management.
A bullish pin bar following an orderly pullback within an uptrend presents a different market condition from an identical candle appearing during an aggressive selloff.
Traders should therefore backtest clearly defined entry and exit rules rather than relying on the appearance of individual candles. Important measurements include win rate, average reward relative to risk, maximum drawdown, and performance after transaction costs.
How to identify high-quality pin bar setups
The strongest pin bar setups generally share three characteristics: meaningful location, decisive price rejection, and confirmation from subsequent market behavior.
A long wick shows where the market failed to sustain a price movement. The surrounding support or resistance level explains why that rejection may matter. The following candles help determine whether buyers or sellers are gaining control.
These factors become particularly useful when they align with the prevailing trend and leave sufficient room for prices to reach a logical profit target.
For traders, the priority should be selecting setups with clear technical justification and manageable risk. A convincing rejection candle can still fail, making disciplined trade selection more valuable than attempting to trade every pin bar.
FAQs
What is the pin bar trading strategy?
The pin bar trading strategy is a price action method that uses long-wick candlesticks to identify potential reversals or trend continuation opportunities at important support and resistance levels.
How do you confirm a bullish pin bar?
A bullish pin bar gains confirmation when prices move above its high or demonstrate renewed buying pressure after rejecting a support level. Confirmation reduces uncertainty but does not guarantee a successful trade.
What is the best timeframe for pin bar trading?
Daily and four-hour charts are widely used for pin bar trading because they provide broader market context. Shorter timeframes can also be useful when combined with higher-timeframe analysis.
Where should a stop-loss be placed in pin bar trading?
For bullish pin bars, the stop-loss is commonly placed below the rejection low. For bearish pin bars, it is generally positioned above the rejection high, allowing for an appropriate volatility buffer.
Can pin bars indicate both reversals and continuations?
Yes. A pin bar forming after an extended trend may indicate a potential reversal, while one appearing during a pullback can signal continuation of the prevailing trend.
What makes a pin bar trading signal unreliable?
Pin bars become less reliable when they form away from important price levels, contradict strong market momentum, lack subsequent confirmation, or appear during unusually volatile trading conditions.