Support
What is the ICT unicorn model?
The ICT Unicorn Strategy is one of the most popular Smart Money Concepts (SMC) entry models because it combines two powerful ideas into one setup: a Breaker Block (BB) and a Fair Value Gap (FVG). Instead of entering immediately after a liquidity sweep, traders wait for price to show confirmation through displacement and then return to a high-probability entry zone.
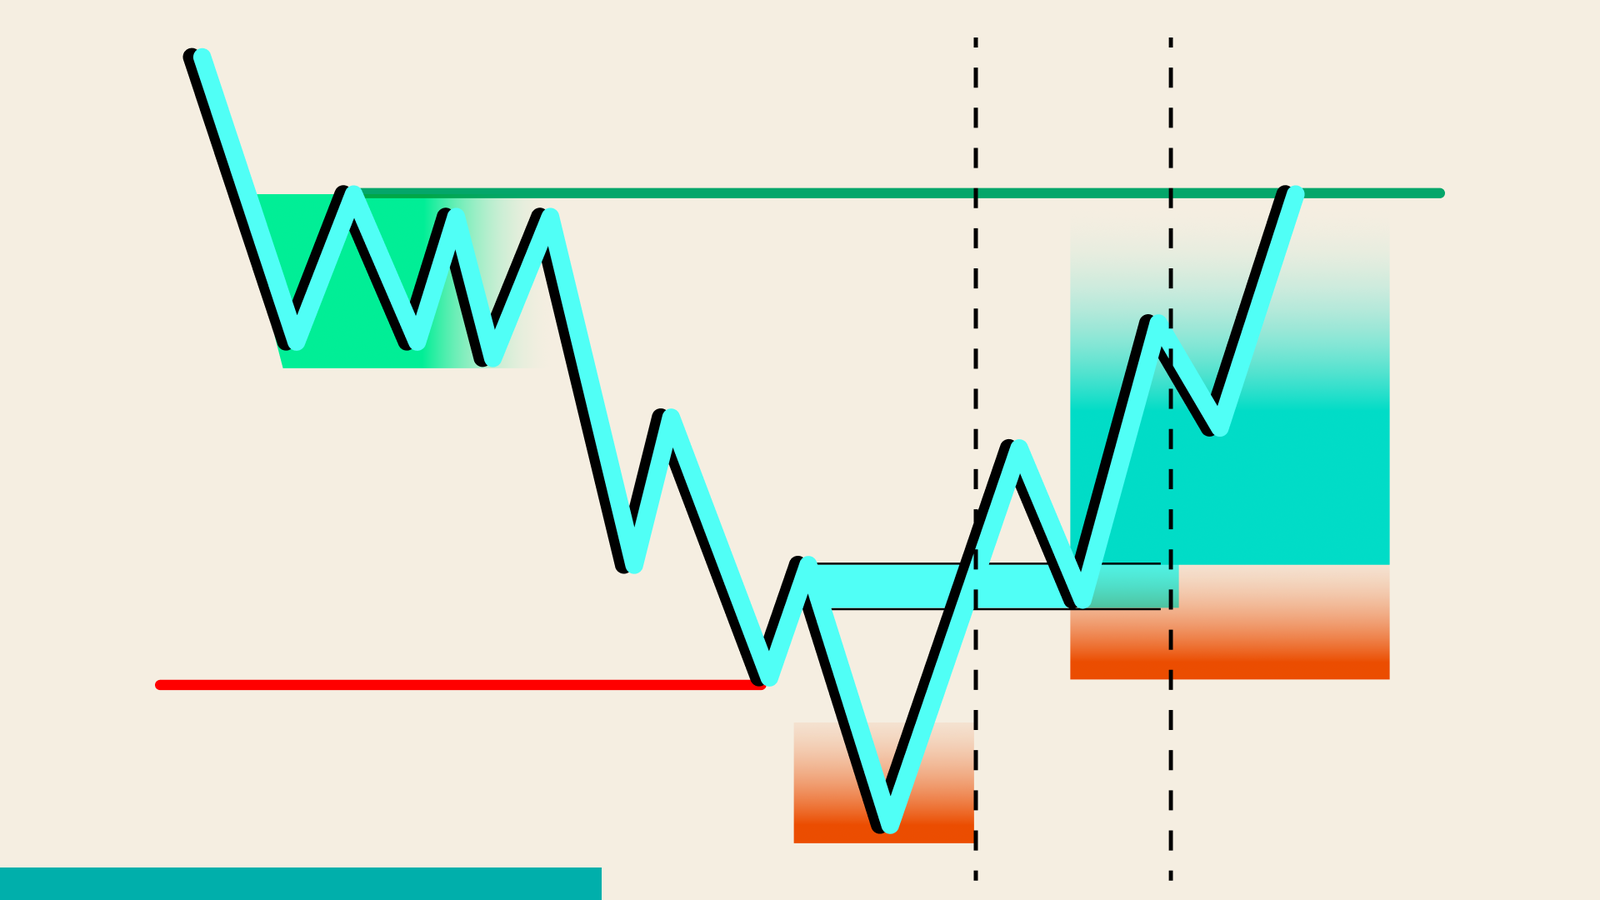
The ICT Unicorn combines a Breaker Block with a Fair Value Gap.
It works after liquidity has been taken and market structure has shifted.
The retracement into the BB and FVG creates the entry.
It works best when aligned with higher-timeframe bias.
Waiting for confirmation helps reduce false entries.
What is the ICT Unicorn?
The ICT Unicorn is a continuation entry model that appears after a liquidity event and a confirmed market structure shift. The setup combines a Breaker Block, which marks the origin of the reversal, with a Fair Value Gap, which marks the imbalance left behind during displacement.
Think of the setup as a sequence rather than a single candle
Price first collects liquidity, then reverses with strong momentum, breaks structure, leaves an imbalance, and finally retraces into that combined zone before continuing.
Breaker Blocks
A Breaker Block is a failed Order Block that changes its role after market structure breaks in the opposite direction.
For example, a bearish Order Block forms during a downtrend. Price then sweeps liquidity, reverses sharply higher, and breaks a previous lower high. That old bearish Order Block is no longer controlling price. Instead, it becomes a bullish Breaker Block that may act as support when price returns.
The same logic works in reverse
A bullish Order Block that fails after a sweep of highs can become a bearish Breaker Block once structure shifts lower.
What makes Breaker Blocks useful is that they are tied to a structural failure rather than simply marking the last candle before a move.
Fair Value Gaps
A Fair Value Gap forms when price moves so aggressively that it leaves an imbalance between candles.
Instead of trading smoothly through every price level, the market skips part of the move. Many ICT traders expect price to revisit that inefficient area before continuing in the direction of displacement.
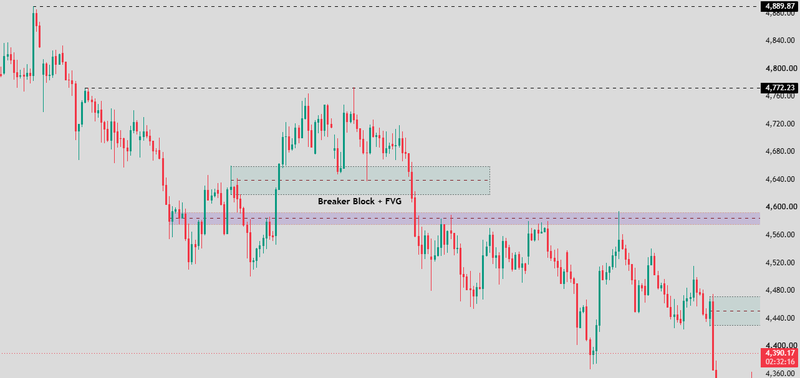
The Fair Value Gap becomes much stronger when it overlaps with a Breaker Block. That overlap is what creates the Unicorn entry zone.
Source: Trading view
How to identify the ICT Unicorn setup
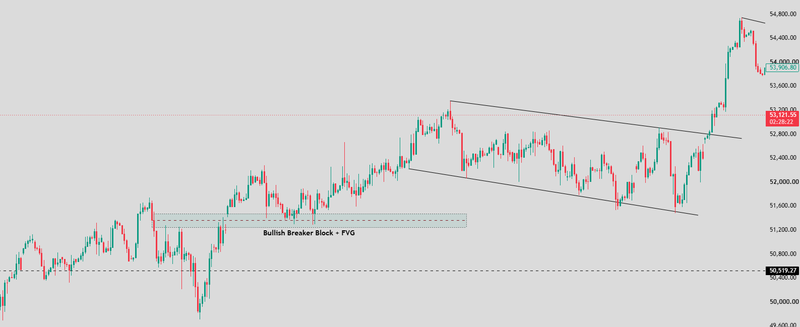
A bullish Unicorn usually begins after price targets sell-side liquidity below recent lows. Price sweeps those lows before reversing with strong displacement. That bullish move breaks a previous lower high, creating a Change of Character or Break of Structure. The displacement leaves behind a Fair Value Gap while the failed bearish Order Block becomes a bullish Breaker Block.
The high-probability entry appears when price retraces into the overlapping Breaker Block and Fair Value Gap before continuing higher.
Source: Trading view
Bearish setup
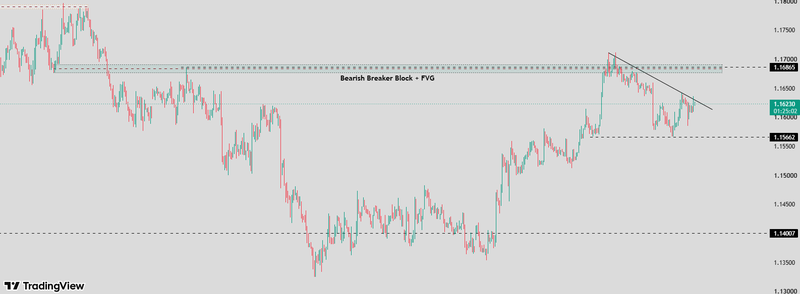
A bearish Unicorn follows the opposite sequence. Price first sweeps buy-side liquidity above recent highs. Buyers enter the breakout while short stops are triggered. The market then reverses with strong bearish displacement and breaks a previous higher low.
That failed bullish Order Block becomes a bearish Breaker Block, while the displacement leaves a Fair Value Gap. The retracement into both zones creates the potential short entry.
Source: Trading view
How to trade the ICT Unicorn strategy
The biggest mistake is entering as soon as liquidity is swept. The Unicorn model requires confirmation first.
The process begins by identifying the higher-timeframe direction. If the broader trend is bullish, traders focus on bullish Unicorn setups. If the higher timeframe remains bearish, they look for bearish versions instead.
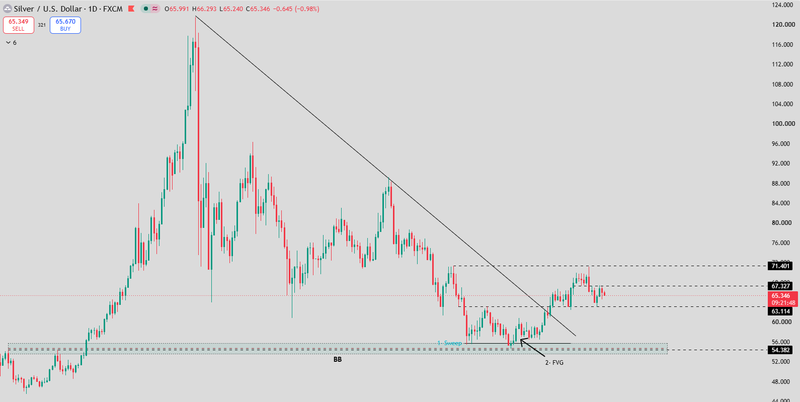
Once liquidity is taken, the next requirement is displacement. The move away from the sweep should be strong enough to break structure clearly. Only after that do traders mark the Breaker Block and Fair Value Gap.
The entry comes when price retraces into that overlapping zone rather than chasing the displacement candle.
Source: Trading view
Long trade example
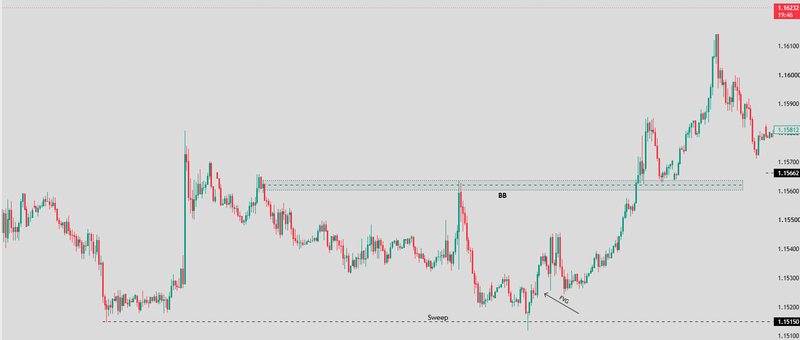
Imagine EUR/USD is trending higher on the four-hour chart. During the London session, price drops below the previous Asian low and takes sell-side liquidity. Instead of continuing lower, buyers step in aggressively.
The rally breaks the previous lower high and leaves a Fair Value Gap. When price retraces into the bullish Breaker Block and fills part of that gap, the long entry becomes available.
The stop sits below the swept low because that is the point where the bullish idea becomes invalid. The target is the next buy-side liquidity area above recent highs.
Source: Trading view
Short trade example
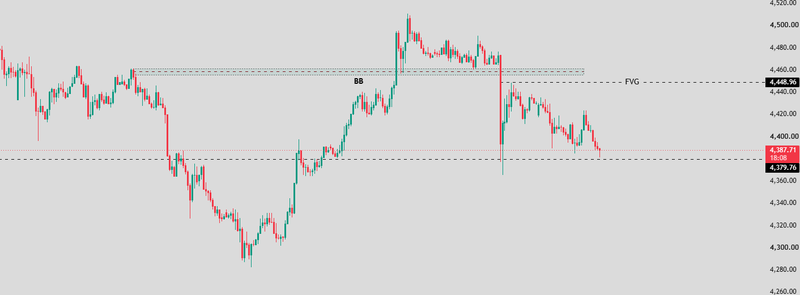
Now imagine gold reaches equal highs before the New York session. Price pushes above those highs, triggers breakout buyers, and then reverses sharply lower. The bearish displacement breaks structure and creates a Fair Value Gap.
When price retraces into the bearish Breaker Block and the imbalance overlaps, the short entry becomes available. The stop remains above the swept high, while the target becomes the next sell-side liquidity below.
Source: Trading view
How to avoid bad ICT Unicorn setups
Not every Breaker Block and Fair Value Gap creates a Unicorn trade. One warning sign is the absence of a liquidity sweep. If price never attacks an obvious liquidity pool, the setup loses one of its strongest pieces of confirmation.
Another common problem is weak displacement. A slow move that barely breaks structure usually carries less conviction than a sharp impulsive move.
Location also matters. A Unicorn setup appearing against the higher-timeframe trend has a lower probability than one that aligns with the broader market direction.
What timeframe does the ICT Unicorn work best on?
The Unicorn strategy works across multiple timeframes, but timeframe alignment usually improves its reliability. Swing traders often build their bias from the Daily and four-hour charts, refine the setup on the one-hour chart, and execute on the fifteen-minute chart.
Intraday traders frequently use the four-hour or one-hour chart for direction before executing on the five-minute or one-minute chart during active sessions such as London or New York. Higher-timeframe Unicorn setups usually carry more weight because they reflect larger liquidity pools, while lower-timeframe versions tend to produce more signals but also more noise.
Risks of the ICT Unicorn strategy
The Unicorn is a high-probability setup, but it is not a guaranteed reversal model. The biggest risk is assuming that every liquidity sweep will produce a valid Breaker Block. Sometimes price simply continues in the original direction after taking liquidity.
Another risk comes from entering before displacement confirms the market structure shift. Without that confirmation, traders can end up fading a trend that has not actually changed.
News events also increase risk. During major releases such as Non-Farm Payrolls or FOMC decisions, price can sweep both sides of the market before establishing direction, making even well-structured setups less reliable.
Finally, traders should avoid placing stops inside the Unicorn zone itself. If price returns too deeply through both the Breaker Block and the Fair Value Gap, the setup has often lost its original structure.
FAQs
What is the ICT Unicorn Strategy?
The ICT Unicorn Strategy is a Smart Money Concepts entry model that combines a Breaker Block and a Fair Value Gap after a liquidity sweep and market structure shift.
What is the difference between a Unicorn and a Breaker Block?
A Breaker Block is one part of the setup. A Unicorn requires both a valid Breaker Block and an overlapping Fair Value Gap before the retracement entry.
Does the Unicorn Strategy need a liquidity sweep?
Yes. A liquidity sweep is one of the key elements because it helps create the conditions for the subsequent market structure shift and displacement.
What timeframe is best for the ICT Unicorn?
Many traders use the Daily or four-hour chart for bias, the one-hour chart for setup, and the fifteen-minute or five-minute chart for execution.