Support
Volatility in trading: what beginners should know
Volatility is a measure of how much an asset’s price changes over time. Although it is often associated with falling markets, it applies to both upward and downward price movement.
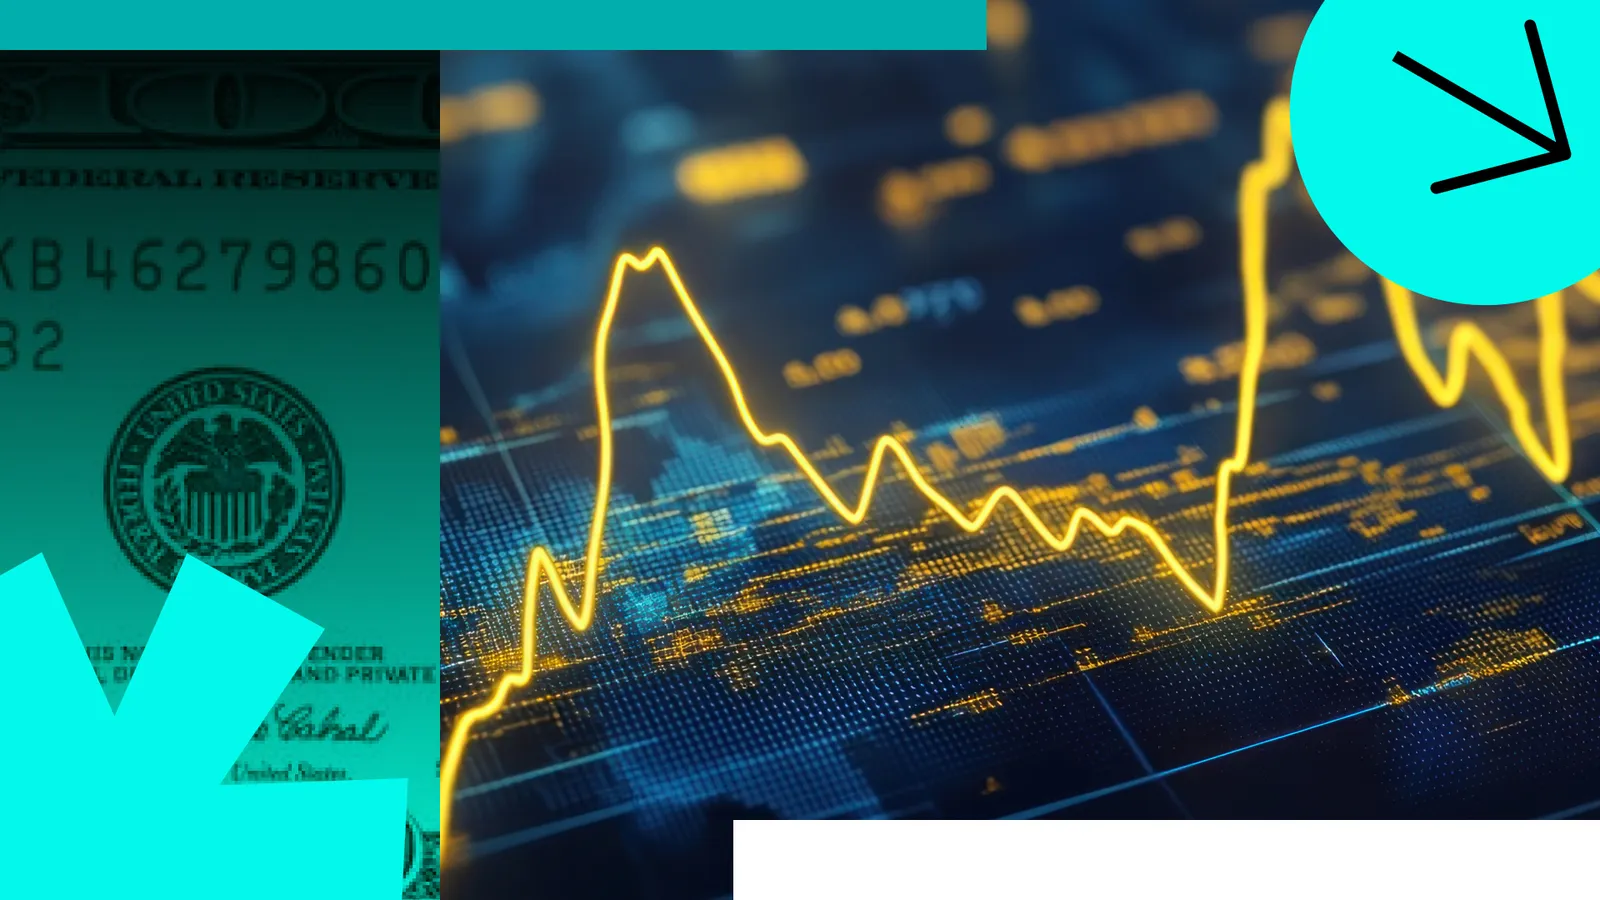
Volatility measures the scale and frequency of price swings across a given period.
A market can be highly volatile even when prices are moving higher.
Historical volatility looks back at previous price changes, while implied volatility focuses on expected future movement.
Key volatility drivers include economic releases, company earnings, geopolitical developments and market sentiment.
What is volatility?
Volatility measures how much the price of an asset changes over a given period. The larger and more frequent those price swings are, the more volatile the market is.
Imagine two stocks. One usually moves less than 1% during a typical trading session, while the other regularly rises or falls by 4% or 5%. Even if both deliver similar returns over several months, the second stock is far more volatile because its daily price swings are much larger.
That is why experienced traders often describe volatility as the market's speed, not its direction. It tells you how aggressively prices are moving, but it says nothing about whether those moves are higher or lower.
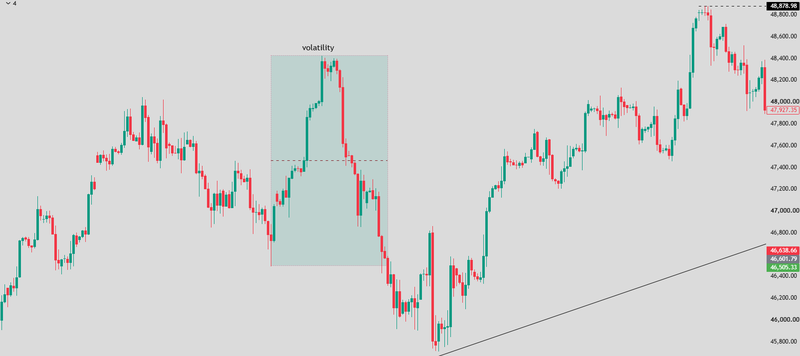
Markets naturally move through periods of calm and periods of uncertainty. During stable conditions, buyers and sellers generally agree on an asset's value, keeping price movements relatively small. When uncertainty increases, opinions begin to diverge.
Source: Trading view
Why is volatility considered a measure of market risk?
Higher volatility doesn't automatically make an investment bad, but it does make short-term outcomes more difficult to predict.
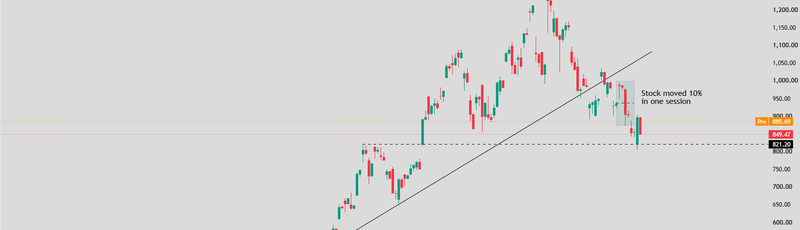
Consider two investments. One rarely moves more than 1% in a day, while the other regularly swings by 6% or 7%. The second may offer greater profit potential, but it also exposes investors to much larger losses over a short period.
That is why volatility is widely used as a measure of market risk. The bigger the price swings become, the harder it is to estimate where prices may be tomorrow, next week or even later in the day.
Still, volatility should not be viewed as something to fear. Many of the world's best-performing stocks have also been among the most volatile. Large technology companies, emerging markets and commodities have all experienced periods of sharp price swings while generating strong long-term returns.
Source: Trading view
How volatility is measured
Unlike forecasts or market expectations, historical volatility is based entirely on what has already happened. It measures how much an asset's price has fluctuated over a specific period, usually the previous 20, 30 or 90 trading days.
If prices have been moving within relatively narrow ranges, historical volatility will be low. If daily price swings become larger and more frequent, the reading rises to reflect that change.
This gives traders useful context. Instead of looking at today's price move in isolation, they can compare it with recent market behaviour. A 3% move might be perfectly normal for one asset but highly unusual for another.
What is VIX?
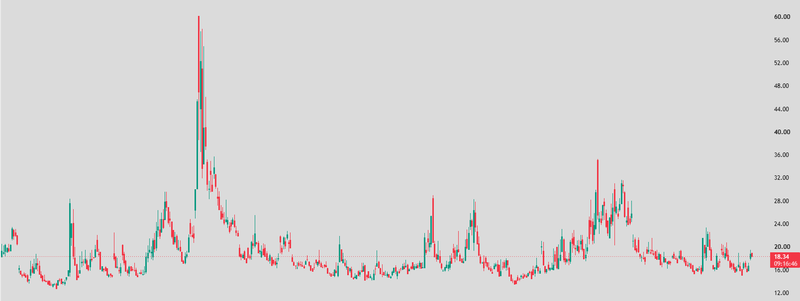
One of the best-known measures of market expectations is the Volatility Index (VIX).
Often referred to as the market's "fear gauge," the VIX measures the expected volatility of the S&P 500 over the next 30 days using options prices. The reason traders watch it so closely is that it offers insight into investor sentiment rather than actual market performance.
When investors become more concerned about the economic outlook or financial markets, they often buy protective put options to hedge against potential losses. As demand for those options increases, their prices rise, pushing the VIX higher. During calmer periods, the opposite usually happens. Investors feel less need for protection, options become cheaper, and the VIX gradually moves lower.
Source: Trading view
How is volatility measured?
Standard deviation is the most widely used measure of historical volatility. It calculates how far an asset's returns tend to move away from their average over a given period. The larger those differences are, the higher the standard deviation and the more volatile the asset is.
In simple terms, assets with a low standard deviation usually experience relatively stable price movements. Those with a high standard deviation tend to make larger and less predictable swings.
This makes standard deviation particularly useful when comparing investments. Two stocks may generate similar long-term returns, but one may have experienced much wider price fluctuations along the way. Standard deviation helps quantify that difference.
Beta shows how an asset moves relative to the market
While standard deviation focuses on an individual asset, beta compares that asset with the broader market.
A beta of 1 suggests that an asset has historically moved in line with the market. If the broader market rises or falls by 1%, the assets would be expected to move by roughly the same amount.
A beta greater than 1 indicates the asset has generally been more sensitive to market movements. For example, a stock with a beta of 1.5 has historically moved about 1.5% for every 1% move in the market, making it more volatile than the overall index.
What causes market volatility?
Reports on inflation, employment, economic growth, retail sales and manufacturing all provide fresh clues about the health of the economy. More importantly, they influence expectations about what central banks may do with interest rates, which is one of the biggest drivers of global financial markets.
The market, however, is rarely reacting to the numbers alone. What matters most is whether the data is stronger or weaker than investors expected.
Take inflation as an example. If inflation comes in below forecasts, traders may begin pricing in earlier interest-rate cuts, supporting equities while putting pressure on the US dollar. If inflation is higher than expected, those expectations can change quickly, lifting bond yields and weighing on stocks and other risk-sensitive assets.
Company earnings
For individual companies, earnings season is usually the most volatile period of the year.
Every quarterly report gives investors new information about sales, profits, future guidance and management's outlook. Together, these updates help shape expectations about the company's future performance.
Yet strong earnings do not always lead to higher share prices. A company may report record profits and still see its stock fall if investors had expected even better results. Likewise, a business can miss earnings estimates but rally if the market believes the outlook is improving or the results are not as weak as feared.
Geopolitical events
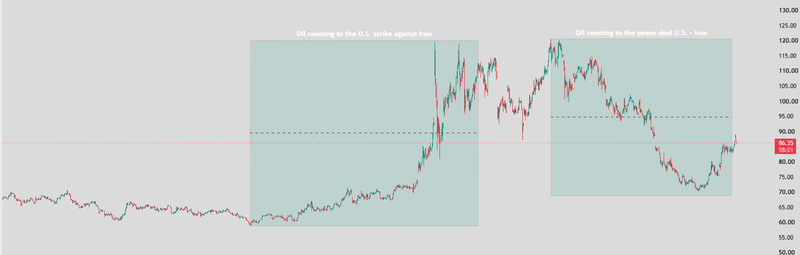
Wars, elections, trade disputes, sanctions and diplomatic tensions all have the potential to affect economic growth, inflation, global trade and energy supplies. When the outcome of these events is uncertain, investors often become more cautious, leading to larger price movements across multiple asset classes.
Source: Trading view
Oil provides one of the clearest examples
A disruption to a major shipping route or rising tensions involving key oil-producing countries can quickly push crude prices higher as traders begin pricing at the risk of supply shortages. Those moves rarely stay confined to the energy market. Higher oil prices can influence inflation expectations, government bond yields, currencies and equity markets as investors reassess the broader economic outlook.
Choosing strategies for different volatility environments
Volatility doesn't just influence how much prices move. It can also affect which trading strategies are more likely to perform well.
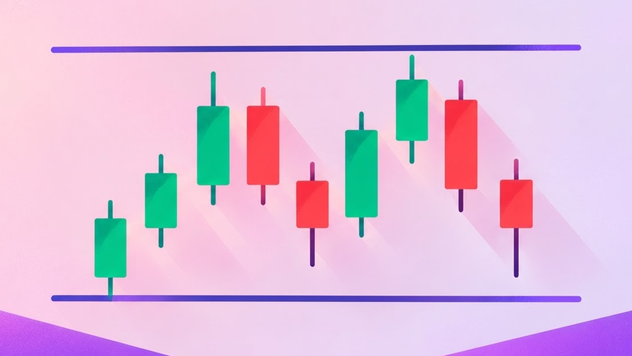
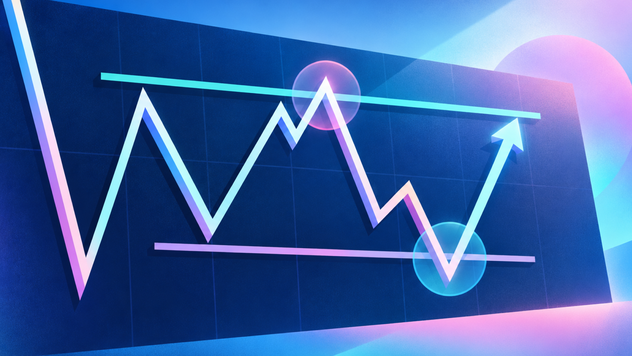
When markets are relatively calm, prices often trade within established ranges. Buyers and sellers are in balance, making it more common for assets to move between areas of support and resistance rather than developing strong trends.
As volatility increases, market behaviour often changes. Larger price swings create stronger momentum and make breakouts more common. Instead of repeatedly reversing within a narrow range, prices are more likely to push beyond key support or resistance levels and continue moving in the same direction. This is why many momentum and breakout traders prefer more volatile markets, where trends can develop quickly.
How to manage risk during volatile markets
Periods of high volatility create more opportunities, but they also increase the risk of large losses. A position that might be manageable in a calm market can become much harder to control once prices begin to widen.
Many traders use stop-loss orders to define their maximum acceptable loss before entering a trade. Rather than making decisions in the middle of a fast-moving market, they identify in advance the point where their trading idea is no longer valid.
FAQs
What is volatility in trading?
Volatility measures how much an asset's price changes over a specific period. Higher volatility means larger and more frequent price movements, while lower volatility reflects more stable price action.
Is high volatility good or bad?
Neither. High volatility increases both potential profits and potential losses. Whether it is beneficial depends on your trading strategy, risk tolerance, and investment horizon.
What causes market volatility?
Economic data releases, corporate earnings, geopolitical events, central bank decisions, investor sentiment, and changes in market liquidity are among the most common causes of volatility.
What is the difference between historical and implied volatility?
Historical volatility measures how much prices have moved in the past. Implied volatility reflects how much the options market expects prices to move in the future.
What is VIX?
The VIX is an index that measures expected 30-day volatility for the S&P 500 based on option prices. It is commonly used as a gauge of investor fear and market uncertainty.