Support
 Whipsaw in trading: what to know
A whipsaw happens when price appears to break out, then quickly reverses in the opposite direction. These moves are often linked to low liquidity, volatility or liquidity sweeps, making confirmation and risk management especially important.
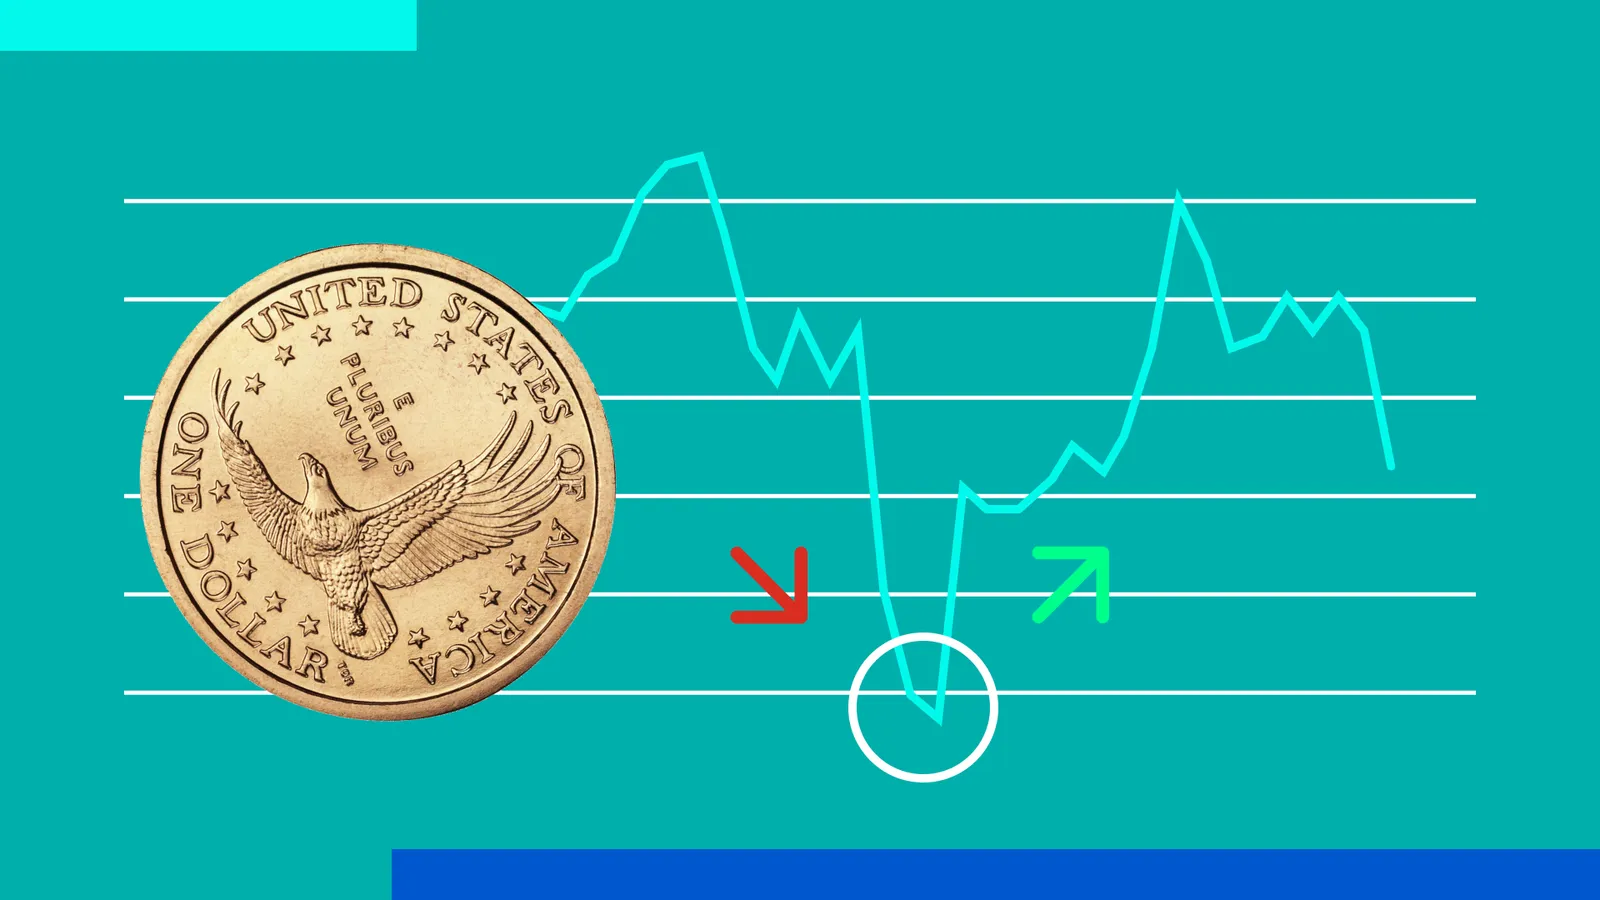
A whipsaw, or “saw effect”, describes a sudden and severe price reversal after a false breakout.
Whipsaw movements often occur in low-liquidity conditions, sideways ranges or around major economic news releases.
Traders use volume confirmation, Average True Range (ATR) readings and multi-timeframe analysis to assess and avoid false breakouts.
Protecting capital over the long term requires clear stop-loss levels and disciplined risk limits on every trade.
What is a whipsaw in trading?
In trading terminology, a whipsaw—frequently referred to as a 'saw effect'—describes a scenario wherein the price of an asset moves rapidly and abruptly in one direction, only to be followed immediately by an aggressive reversal in the opposite direction.
Whipsaw definition
Microstructurally, a whipsaw is the manifestation of extreme market indecision coupled with high implied volatility. It represents a sharp, counter-directional reversal that immediately invalidates a preceding impulse move. There are two primary classifications of this phenomenon:
- Bullish Whipsaw: This occurs when an asset's price forcefully breaches a key resistance level, enticing breakout buyers seeking to capitalise on upward momentum, before violently reversing below that breached resistance level.
- Bearish Whipsaw: This occurs when an asset's price decisively pierces an established support level, attracting short positions aiming to exploit lower prices, only to reverse abruptly and rally strongly back above the invalidated support floor.
How whipsaws appear on a price chart
On a price chart, a whipsaw generally reflects the systematic absorption or liquidation of retail trader positions by larger market participants. Consequently, this phenomenon is widely referred to as a false breakout or a 'liquidity sweep'. Visually, it is characterised by candlesticks with unusually long wicks or tails, illustrating how aggressive counter-positions were activated immediately after the initial breakout momentum was exhausted.
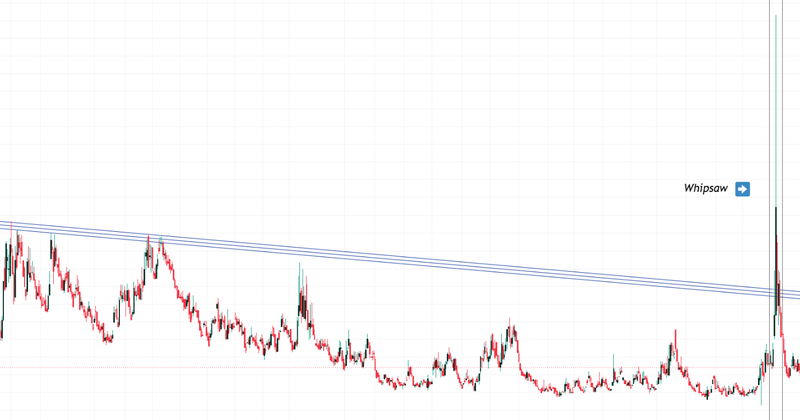
Figure 1. Whipsaw Example. Source: Own analysis conducted via TradingView.
Why whipsaws matter to traders
Experiencing a whipsaw movement carries significant risks for a market participant, most notably capital impairment and psychological distress. From an equity perspective, if proper risk management is neglected and a stop-loss is placed too far from the entry price—or omitted entirely—an aggressive, unexpected reversal can severely deplete account balance. From an emotional perspective, the psychological shock of a rapid reversal often triggers destructive behavioural biases, such as revenge trading, over-leveraging, and rule abandonment.
Common causes of whipsaw price action
While numerous market mechanics contribute to the formation of whipsaws, two foundational drivers stand out: low liquidity and elevated volatility.
Low liquidity and wide spreads
Markets or trading sessions characterised by thin liquidity inherently foster erratic price shifts. When market depth is sparse, even modest market orders can sweep through available liquidity levels rapidly, driving the price towards deeper levels in the order book to match pending counter-orders. Furthermore, the wider bid-ask spreads typical of low-liquidity environments amplify price slippage, leading to sudden, sharp price dislocations.
Range-bound markets
Consolidation ranges represent prime environments for whipsaw occurrences. Because retail traders frequently cluster stop-loss and breakout entry orders just beyond established support and resistance boundaries, institutional participants with substantial capital capacity often exploit these liquidity pools. By driving price beyond range extremes to trigger these pending orders, institutions secure more favourable fill prices before initiating a mean-reversing move. Consequently, false breakouts are highly prevalent within lateral chart patterns.
News, earnings, and economic releases
Major economic reports, corporate earnings announcements, and sudden geopolitical developments trigger rapid influxes of trading volume alongside elevated implied volatility. These volatile shifts are driven by both manual traders and high-frequency algorithmic execution. In the absence of a clearly established trend, this surge in volatility frequently results in erratic price swings and violent reversals.
How to identify whipsaw conditions
Traders can deploy technical analysis tools alongside multi-timeframe confirmations to identify potential whipsaw environments and filter out false signals.
Volatility and ATR signals
The Average True Range (ATR) indicator is a core tool for quantifying market volatility based on historic price ranges. While the ATR alone does not explicitly forecast a whipsaw, pairing it with volume metrics helps determine whether a technical breakout stems from genuine institutional momentum or merely deceptive volatility and liquidity manipulation.
Support and resistance confirmation
Thorough support and resistance analysis is vital for filtering out whipsaws. Crucially, breakout signals must be cross-examined against volume metrics. For instance, if an asset breaks above a resistance level, that move should ideally be accompanied by above-average trading volume to support the premise that institutional buying interest is genuinely sustaining the breakout.
Timeframe selection and multi-timeframe checks
A practical filter against false breakouts is allowing a price bar or candlestick to fully close before entering a trade. For swing strategies spanning days or weeks, waiting for the daily candlestick close provides confirmation of whether buyers or sellers maintained structural control by the end of the session.
Additionally, conducting multi-timeframe analysis on lower horizons (such as hourly or minute charts) allows a trader to examine microstructural buying and selling pressure. This granular perspective clarifies the underlying directional bias and the chronological stability of the movement.
How to trade and reduce whipsaw risk
Deploying structured analytical filters alongside strict capital management strategies significantly mitigates the financial exposure associated with whipsaws.
Confirmation rules and entry filters
Traders should avoid executing positions based on a single technical factor, such as an isolated price breach. Best practice involves establishing systematic confirmation rules prior to entry. For example, a technical breakout should be validated through volume analysis, alongside momentum indicators such as moving averages or the Relative Strength Index (RSI), to gauge underlying strength and potential move sustainability.
Stop placement
Implementing a disciplined stop-loss strategy is crucial, particularly when trading leveraged derivative instruments. To mitigate whipsaw risk, traders often utilize an ATR-based stop-loss, placing the exit point at a multiple (N×ATR) from the entry price. When volatility rises, the ATR expands, widening the stop-loss distance automatically to prevent premature stop-outs during temporary market noise.
Position sizing
Position sizing is a cornerstone of capital preservation. When trading derivatives such as Contracts for Difference (CFDs), sizing governs the precise margin percentage risked relative to total account equity. For instance, if a trader caps risk at 2% per trade on a $10,000 account balance, the maximum monetary risk is close to $200 (10,000×0.02). Adhering to this limit ensures that should a whipsaw occur, the financial impact remains controlled and manageable.
Conclusion
The whipsaw phenomenon remains one of the most formidable challenges in active trading due to its capacity to erode both financial capital and psychological discipline. Nevertheless, understanding its underlying microstructure—alongside catalysts such as low liquidity, institutional liquidity sweeps, and macroeconomic announcements—enables traders to approach the market with professional rigor. By integrating volume confirmation, awaiting candlestick closes, and applying robust position sizing, traders can transform this threat into an operational advantage rooted in consistency and precision.
If you're interested in trading indices, foreign exchange, shares, or commodities, consider exploring the CFD contracts offered by Equiti Group. Please note that trading leveraged derivatives involves a high level of risk and may not be suitable for all investors.
FAQs
What is a whipsaw in trading and what are its main types?
A whipsaw—or 'saw effect'—is a sharp, impulsive price movement immediately followed by an aggressive reversal in the opposing direction, reflecting high market volatility and structural indecision. The two main types are the Bullish Whipsaw, where price breaks above resistance to entice buyers before dropping sharply, and the Bearish Whipsaw, where price pierces support to attract short sellers before rallying strongly upward. Both scenarios result in false breakouts that frequently sweep retail liquidity.
What are the main causes that generate a whipsaw effect?
The primary drivers are low liquidity and elevated implied volatility. During periods of thin market depth and wide spreads, relatively small orders can cause disproportionate price spikes. Whipsaws are also common within consolidation ranges, where institutional traders trigger clustered retail stop-loss orders beyond support and resistance to secure liquidity at advantageous prices. Additionally, high-impact news, corporate earnings, and economic data releases induce rapid price swings that lack sustained directional follow-through.
How can whipsaw conditions be identified using technical analysis?
Identifying whipsaw conditions requires combining technical tools. The Average True Range (ATR) indicator measures underlying volatility; when evaluated alongside trading volume, it helps distinguish genuine breakouts from manipulative sweeps. Authentic breakouts typically demand above-average volume. Furthermore, awaiting the definitive close of a candlestick (such as a daily bar) and analysing lower timeframes to assess underlying buying or selling pressure provides crucial confirmation before entering a trade.
What strategies can reduce and manage the risk of a whipsaw?
To manage whipsaw risk, traders should avoid single-factor entries and enforce multi-indicator confirmation rules incorporating metrics like RSI, moving averages, and volume. For risk management, stop-loss orders can be set as multiples of the ATR, dynamically adjusting exit distances to accommodate prevailing volatility and avoid premature stop-outs. Finally, strict position sizing—limiting risk per trade to a fixed percentage of total capital (e.g., 1–2%)—ensures that any resulting losses remain strictly controlled.