Help
Help A technical overview of Cardano's price performance
Cardano remains under selling pressure after an 87% decline from its 2025 peak, but consolidation above key support and improving momentum indicators suggest the potential for a short-term recovery.
Cardano has fallen by around 87% from its December 2025 peak of $1.23 to approximately $0.16.
ADA is consolidating between $0.15 and $0.18, with a significant volume distribution emerges near $0.15.
A bullish MACD divergence and rising RSI signal improving short-term momentum and recovery potential.
Date: 16 July 2026
Cardano remains under selling pressure but holds above a key support zone
Cardano’s price has experienced sustained selling pressure over recent years. Since reaching a peak of $1.23 in December 2025, the cryptocurrency has declined to around $0.16, representing an approximate drawdown of 87%. This sharp depreciation has been accompanied by a broader loss of confidence across the cryptocurrency market, as geopolitical and economic instability has reduced investors’ appetite for high-risk assets. Ongoing tensions in the Middle East, together with rising expectations that the Federal Reserve could maintain a restrictive monetary policy stance, have continued to weigh on high-beta assets such as cryptocurrencies.
However, Cardano’s price decline has recently stabilised, with price action beginning to show early signs of recovery. The cryptocurrency is currently consolidating within a range of $0.15 to $0.18. Notably, the Volume Profile’s Point of Control (POC) shows a significant concentration of trading activity near the $0.15 level, which could indicate a potential accumulation process. It is also relevant to note that the current POC area appears more significant than the previous High-Volume Node (HVN) near $0.26, despite the current support zone having developed over a shorter period.
Nevertheless, Cardano continues to trade below its long-term 50-day, 100-day, and 200-day Simple Moving Averages (SMAs), confirming that selling pressure remains active. This technical divergence may reflect a divided market outlook. On the one hand, some investors and traders may consider current prices to represent a significant discount zone. On the other hand, a separate group of market participants may continue to view Cardano as an asset with an unfavourable risk-adjusted return, particularly given the elevated uncertainty across global markets.
Meanwhile, the Moving Average Convergence Divergence (MACD) is exhibiting a bullish divergence, while the Relative Strength Index (RSI) is beginning to show upward momentum. This combination suggests that Cardano could experience a period of bullish momentum, at least in the short term, provided that buying interest continues to strengthen.
In a bullish scenario, Cardano would need to break above the short-term resistance area near $0.185. If this level is surpassed, the next relevant technical ceiling would be located at around $0.25, a structural resistance zone that also converges with the 200-day SMA. A sustained move above these levels would be necessary to support the possibility of a transition towards higher valuation levels.
Conversely, in a bearish scenario, if selling pressure resumes and the short-term support near $0.15 is breached to the downside, the next significant level would be $0.09. This area is particularly relevant because it corresponds to Cardano’s debut price in December 2017. If this level fails to hold, the next major downside reference would be the historical low zone near $0.03.
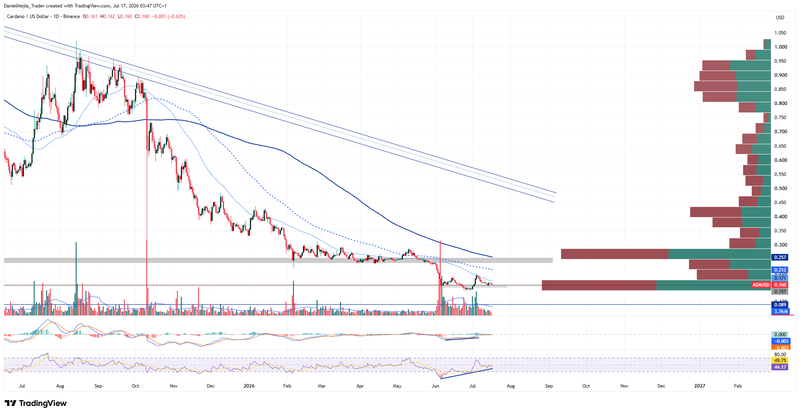
Figure 1. Cardano Prices (2025–2026). Source: Data from the Binance Exchange; own analysis conducted via TradingView.