Help
Help A technical overview of Solana price performance
Solana remains under pressure after a 69% decline from its 2025 peak, although its technical indicators are improving.

Solana has fallen from $247 to $77 since September 2025, representing a drawdown of approximately 69%.
Geopolitical tensions and hawkish monetary policy expectations have reduced demand for high-risk crypto assets.
Solana is consolidating between $68 and $95, with the price attempting to move above its key 50-day and 100-day Simple Moving Averages (SMAs).
A bullish MACD divergence and a rising RSI suggest recovery potential, although $92 remains a major resistance level.
Date: 15 July 2026
Technical evaluation of Solana’s price action
Solana’s price has experienced sharp selling pressure over the past eight months. Since reaching a peak of $247 in September 2025, the price has declined to $77, representing a drawdown of approximately 69%. This significant depreciation has been accompanied by a growing loss of confidence in the crypto market, as geopolitical and economic instability has reduced appetite for high-risk assets.
Notably, the US–Israel–Iran conflict in the Middle East has generated severe disruptions to global energy supply chains, thereby raising expectations that central banks worldwide could return to more hawkish monetary policy stances. Against this backdrop, institutional investors have reduced their exposure to high-risk assets, including cryptocurrencies.
However, Solana’s depreciation has stabilised, while its price action has begun to exhibit signs of recovery. The price is currently consolidating within a range between $68 and $95, where the Volume Profile’s Point of Control (POC) indicates a significant concentration of trading activity. This suggests that the price has been unable to move into lower price-discovery territory and is returning towards an important area of market interest. In addition, Solana is attempting to break above its longer-term 50-day and 100-day Simple Moving Averages (SMAs).
Concurrently, the Moving Average Convergence Divergence (MACD) is exhibiting a bullish divergence, while the Relative Strength Index (RSI) is showing upward momentum. This combination of factors suggests that Solana could develop bullish momentum, at least in the short term.
Conversely, the bearish scenario signals a significant resistance near $92, where the POC, the 200-day SMA, and a structural resistance level converge. The confluence of these technical levels could trigger renewed selling pressure. Nevertheless, if this zone is breached to the upside, a substantial increase in buying pressure could lift Solana’s market capitalisation towards higher levels.
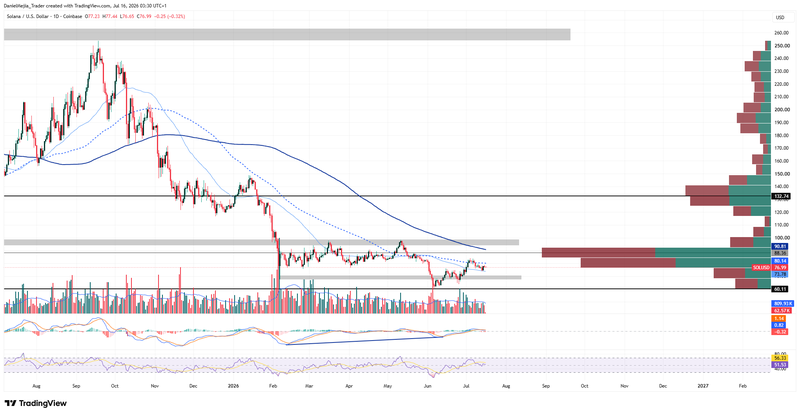
Figure 1. Solana Prices (2025–2026). Source: Data from the Coinbase Exchange; own analysis conducted via TradingView.