Altcoin market cap tests key technical zone amid rising inflation risks
The aggregate altcoin market capitalisation is currently testing a critical structural support zone as escalating geopolitical tensions, sticky inflationary pressures, and expectations of a prolonged hawkish stance from the Federal Reserve damp risk appetite.

The altcoin market capitalisation is hovering around a key historical threshold, with Bitcoin dominance rising to 58%, leaving altcoins with a 42% share of the aggregate digital asset market.
Heightened geopolitical risks and persistent inflation are reinforcing expectations of a hawkish Federal Reserve, driving institutional outflows from spot crypto ETFs and reducing exposure to high-beta assets.
Speculative liquidity is actively rotating into the expanding AI sector and highly anticipated mega-cap equity listings, draining essential volume away from broader digital asset markets.
Altcoin Market Cap Edges Toward Key Technical Zone on Rising Geopolitical Risks
The aggregate market capitalisation of altcoins is presently testing a vital structural support area. This juncture represents a critical technical pivot that will either serve as a base for a structural rebound toward higher liquidity zones or precipitate a deeper market contraction if selling pressure intensifies. At present, Bitcoin dominance stands at 58% of the total cryptocurrency market capitalisation, restricting the collective share of altcoins to 42%.
The broader digital asset market has faced significant headwinds from escalating geopolitical friction and growing market expectations that the Federal Reserve will maintain a restrictive monetary policy stance to combat persistent inflationary pressures. This risk-off environment has triggered a notable acceleration in capital outflows from exchange-traded funds (ETFs) linked to digital assets—most conspicuously those tracking Bitcoin and Ethereum. Institutional investors are actively reducing exposure to high-beta crypto-assets in favour of defensive allocations.
Concurrently, reports from financial networks such as Bloomberg and Reuters highlight that market participants are possibly rotating capital toward artificial intelligence equities and mega-cap IPOs. Although these equity instruments carry an inherently high risk profile, their prominent capital returns are successfully drawing speculative flows away from crypto networks.
Global macro traders and market participants are now intensely focused on two major upcoming milestones: the release of crucial US inflation data on Wednesday, 10 June, and the highly anticipated SpaceX IPO scheduled for 12 June 2026.
Technical Analysis of Altcoins Market Capitalisation
From a technical perspective, the altcoin market capitalisation is navigating a highly precarious structural alignment. A detailed assessment of the chart architecture reveals several critical observations:
- Trend Context: On higher timeframes, the aggregate altcoin market capitalisation continues to trade systematically below its 50-day, 100-day, and 200-day Simple Moving Averages (SMAs). This negative alignment reinforces an underlying bearish bias. In the immediate short term, price action is testing a long-term horizontal support boundary.
- Resistance Levels: Should a short-term technical rebound occur, the immediate structural resistance sits at the $1 trillion psychological threshold. Beyond this level, the next major technical ceiling is identified at the $1.06 trillion mark, which confluences directly with the descending 200-day SMA. Reclaiming this benchmark is widely considered a prerequisite for re-establishing broader, long-term bullish conviction across the wider alternative digital asset class.
- Support Levels: Conversely, if the immediate short-term support at $850 billion is compromised on a daily closing basis, the next critical structural floor is located at the $780 billion horizontal boundary. A sustained break below this zone would likely accelerate cascading derivative liquidations and spot selling pressure, significantly heightening the probability of a deeper market correction.
- Momentum Indicators: The Moving Average Convergence Divergence (MACD) indicator continues to exhibit a downward trajectory, suggesting that bearish momentum remains firmly in force. However, the Relative Strength Index (RSI) is hovering near oversold territory, signalling that the asset class is technically overextended and potentially primed for a localized technical rebound.
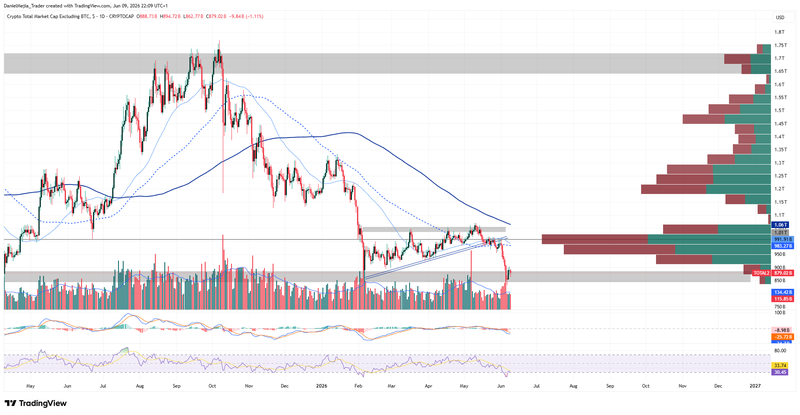
Figure 1. Altcoins Market Cap (2025–2026). Source: Own analysis conducted via TradingView.


