Help
Bitcoin falls as investor risk aversion intensifies following US stock selloff
Intensified investor risk aversion amid sharp selloffs across US equity markets has driven Bitcoin down by 5.5% to $76,050 following Democratic midterm victories, prompting a potential capital rotation towards traditional safe-haven assets.

Democratic control of both chambers of Congress has raised apprehension over potential restrictions on artificial intelligence (AI) and semiconductor technology.
US equities experienced severe downside pressure, led by a 6.36% decline in the tech-heavy Nasdaq 100.
High-risk assets faced heightened liquidation, reflecting historically strong stock-cryptocurrency correlations during market contraction regimes.
Investors appear to be reallocating capital into traditional safe havens, driving gains in precious metals and sovereign bonds.
Date: 6 November 2026 (GMT+3)
Why is the US stock selloff pressuring cryptocurrencies?
Bitcoin’s price plunged by 5.5% to $76,050 following a severe downturn in US equity markets, as market participants expressed growing concern over the prospect of tighter regulations on artificial intelligence (AI) under a Democratic-led Congress.
With the Democratic Party securing majorities in both chambers of Congress following the midterm elections, market participants fear increased regulatory oversight of AI development, particularly within the semiconductor industry and data centre infrastructure. This factor has drawn heightened scrutiny because the escalating energy and water consumption of AI data centres places growing pressure on local resources, potentially exacerbating competition between technological infrastructure and the essential resource needs of surrounding communities.
Consequently, major US stock indices suffered substantial losses: the S&P 500 dropped by 4.36%, the Dow Jones Industrial Average fell by 3.44%, and the tech-heavy Nasdaq 100 plunged by 6.36%. Concurrently, the Cboe Volatility Index (VIX) surged by 69.70%, underscoring widespread market uncertainty.
Against this backdrop, cryptocurrencies typically underperform during periods of heightened selling pressure in US equity markets, as risk-averse investors divest from speculative assets. Empirical data spanning 2019 to 2026 indicates that the S&P 500 index and Bitcoin display a heightened positive correlation during contractionary market regimes, highlighting how broader risk aversion weighs on digital assets when market volatility in the US stock market spikes.
Conversely, precious metals—including gold, silver, and platinum—have recorded a price recovery over the past four trading sessions. Meanwhile, 10-year US Treasury yields have contracted for a full week, reflecting increased demand for sovereign bonds given the inverse relationship between bond prices and yields. Such traditional safe-haven assets typically attract capital inflows as market participants seek hedges against severe drawdowns in high-risk asset classes.
Technical analysis of Bitcoin
From a technical perspective, Bitcoin maintains a bullish structure despite intensifying short-term selling pressure. A detailed examination of the current market structure reveals several key technical observations:
- Trend Context: On daily timeframes, Bitcoin retains underlying bullish momentum, continuing to trade above its 200-day Simple Moving Average (SMA). However, short-term selling pressure has driven the price below its 50-day and 100-day SMAs. Notably, Bitcoin rejected the 50% Fibonacci retracement of the previous bullish impulse to the upside, indicating that the primary upward trend remains intact.
- Momentum Indicators: Both the Moving Average Convergence Divergence (MACD) and the Relative Strength Index (RSI) are displaying downward trajectories, suggesting that the short-term selling pressure could persist.
- Resistance Levels: Should bullish momentum regain strength, the first significant technical ceiling sits at 82,000 (a structural resistance), followed by a secondary major resistance level at 86,500 (the previous peak level).
- Support Levels: If short-term selling pressure intensifies, the primary technical support zones lie at 73,000—where the 200-day SMA converges with the 61.8% Fibonacci retracement level—and 69,500, corresponding to the Volume Profile’s Value Area Low (VAL).
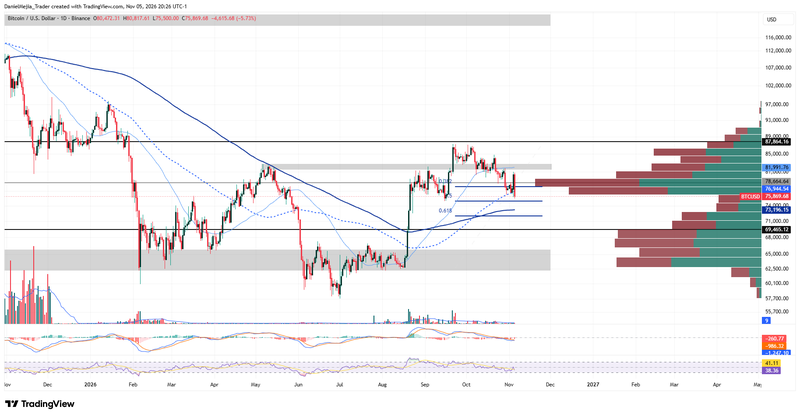
Figure 1. Bitcoin’s Price (2025–2026). Source: Data from Binance Exchange; author's analysis conducted via TradingView.