
 Help
Help Bitcoin implied volatility rebounds from lows amid geopolitical uncertainty
Bitcoin’s implied volatility index (BVIV) is rebounding from historical lows amid severe geopolitical instability. Despite tentative US-Iran ceasefire talks to secure the Strait of Hormuz, new US sanctions and escalating Israel-Hezbollah conflicts have heightened market anxiety, causing Bitcoin to slide to a key support zone at $73,488.
The BVIV index is bouncing off an all-time low, signalling that the cryptocurrency market may face a prolonged period of heightened price swings if macroeconomic and geopolitical tensions persist.
A tentative 60-day US-Iran ceasefire extension seeks to guarantee unhindered commercial shipping through the Strait of Hormuz; however, the framework remains highly delicate and awaits final approval from US President Donald Trump.
New sanctions imposed by Washington against Iranian military oil trade, coupled with intensifying military engagements between Israel and Hezbollah, continue to underscore a volatile Middle Eastern security outlook.
In the spot market, Bitcoin fell 1.14% to test structural support at $73,488, while the BVIV index displays an oversold RSI and a bullish MACD divergence.
Bitcoin volatility rebounds from long-term lows amid geopolitical instability
The Bitcoin Volmex Implied Volatility (BVIV) index has recently hovered near all-time historical lows, defying the elevated economic and geopolitical uncertainty around the world. Structurally, the BVIV index functions analogously to the equity market's VIX index, measuring the market's expected 30-day volatility derived from crypto options pricing. Higher BVIV levels traditionally reflect an increase in market fear and uncertainty, whereas lower prints signal stability. Consequently, a meaningful expansion in implied volatility from these depressed levels could herald either a sharp retracement from current spot prices or a violent upward extension, depending on how market sentiment shifts in response to incoming geopolitical headlines.
As reported by Reuters, negotiators from the United States and Iran have successfully drafted a memorandum of understanding regarding a potential 60-day ceasefire extension. Nevertheless, the formal implementation of this preliminary agreement remains strictly conditional upon the final approval of US President Donald Trump. Sources familiar with the matter indicate that the proposed framework is designed to restore unhindered commercial shipping through the Strait of Hormuz, with comprehensive bilateral negotiations scheduled to take place during the course of the 60-day truce.
However, during the same trading session, Washington announced fresh sanctions explicitly targeting Iran's military oil trade, complicating the diplomatic track between Washington and Tehran. Simultaneously, ongoing bilateral military engagements between Israel and Hezbollah in Lebanon continue to intensify, serving as a stark reminder that any overarching regional security agreement remains highly unstable.
Reflecting this renewed anxiety, Bitcoin depreciated by 1.14% by the market close, settling at $73,488 and testing a prominent support zone within its immediate price action structure.
Technical analysis of the BVIV index
From a technical perspective, the BVIV index is actively testing its historical floor. A detailed breakdown of the current index structure reveals several key technical developments:
- Trend Context: On longer timeframes, the BVIV index continues to trade well below its descending 50, 100, and 200-day Simple Moving Averages (SMAs). While this positioning reinforces a dominant long-term bearish bias, the immediate price action shows the index stalling at an all-time low, establishing a technical base for a potential short-term structural reversal.
- Resistance Levels: Should immediate short-term resistance near the 40-point mark be surpassed, the next major technical ceiling is identified at 49 points—a level currently reinforced by the descending 200-day SMA. A decisive weekly close above the 49 zone would signal a transition into a high-volatility regime for Bitcoin.
- Support Levels: If the primary structural support at 36.50 points is broken, the next critical floor rests at the 34 mark, which defines the index's ultimate historical minimum level. A sustained move below this threshold would likely indicate a deeper period of market consolidation and suppressed options pricing.
- Momentum Indicators: The Moving Average Convergence Divergence (MACD) is currently printing a bullish divergence on shorter timeframes, although its immediate upward trajectory remains modest. Concurrently, the Relative Strength Index (RSI) is trading deeply within oversold territory, further validating the probability of a short-term bounce in the volatility index.
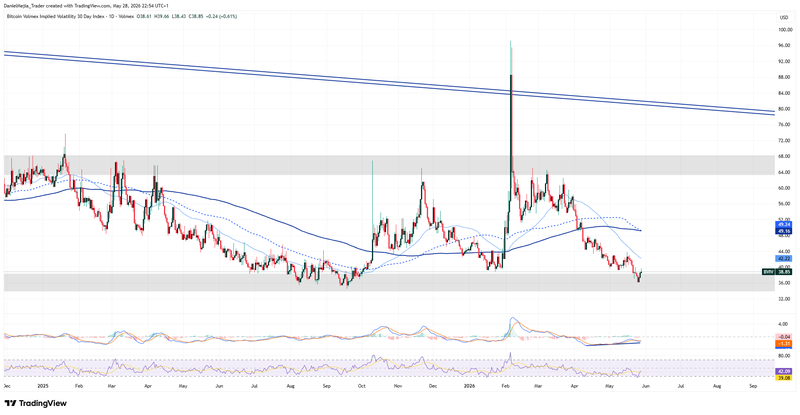
Figure 1. BVIV Index (2025–2026). Source: Own analysis conducted via TradingView.


